
More Information
Submitted: April 02, 2026 | Accepted: April 14, 2026 | Published: April 15, 2026
Citation: Akbar A, Hussain WG. From Wallets to Waistlines: Exploring the Link between Family Income (Wage Distribution) and Obesity Indices in Pakistani Populations. New Insights Obes Gene Beyond. 2026; 10(1): 001-014. Available from:
https://dx.doi.org/10.29328/journal.niogb.1001024
DOI: 10.29328/journal.niogb.1001024
Copyright license: © 2026 Akbar A, et al.. This is an open access article distributed under the Creative Commons Attribution License, which permits unrestricted use, distribution, and reproduction in any medium, provided the original work is properly cited.
Keywords: Novel mutation; Red blood cell; Cytoskeletal; Laboratory diagnosis; Diseases
Abbreviations: ANOVA: Analysis of Variance; BSA: Body Surface Area; BMI: Body Mass Index; BSSI: Body Shape and Size Index; CDC: Centers for Disease Control and Prevention; PI: Ponderal Index; SES: Socio-Economic Status; BM: Body Mass; SD: Standard Deviation; SE: Standard Error; Var: Variance

From Wallets to Waistlines: Exploring the Link between Family Income (Wage Distribution) and Obesity Indices in Pakistani Populations
Atif Akbar1 and Waqas Ghulam Hussain2*
1Department of Statistics, Bahauddin Zakariya University, Multan, Pakistan
2Higher Education Department, South Punjab, Pakistan
*Address for Correspondence: Dr. Waqas Ghulam Hussain, PhD., Department of Statistics, Higher Education Department, South Punjab, Pakistan, Email: [email protected]
Obesity represents a significant public health challenge on a global scale, with its prevalence increasingly linked to socio-economic factors, most notably family income. This study investigates the relationship between family income and several obesity measures specifically, the Body Shape and Size Index (BSSI), Body Mass Index (BMI), Body Surface Area (BSA), Ponderal Index (PI), Weight/Body Mass (BM), and Height within a sample of 9,906 respondents from Pakistan. Utilizing descriptive statistics and p - values, the analysis aims to provide a comprehensive understanding of how variations in income affect these obesity indicators, ultimately informing potential public health interventions. The findings reveal a complex, variable association between family income levels and obesity measures that differs by the specific obesity index examined. For BSSI, individuals in the lowest income bracket demonstrated higher values (indicating greater adiposity), while for BMI and weight, higher income brackets showed elevated values. These mixed findings suggest that the direction of association depends critically on which obesity measure is analysed. The study reveals that lower-income families are more likely to face barriers in accessing nutritious food, engaging in physical activity, and achieving favourable health outcomes. This situation is often exacerbated by economic constraints that drive families toward caloric-dense, nutrient-poor food choices. The implications of this research are far-reaching, emphasizing the need for targeted public health strategies to address obesity, particularly among economically disadvantaged populations. The study advocates for policies that enhance food security, improve access to health-promoting resources, and create supportive environments for physical activity. Through a nuanced exploration of these relationships, the research aims to contribute valuable insights to the field of public health, promoting equity in health outcomes and addressing the root causes of obesity in Pakistan.
Obesity has escalated to become one of the most pressing public health concerns of the 21st century, closely associated with a multitude of adverse health conditions, including type 2 diabetes, cardiovascular diseases, and several forms of cancer [1]. According to the Hortat, et al. [2], the global prevalence of obesity nearly tripled between 1975 and 2021. This alarming trend has focused attention on understanding the various factors that contribute to obesity, highlighting the need for a multifaceted approach to address this systemic issue. While biological and genetic factors undoubtedly influence individual weight, socio-economic factors play an equally critical role in shaping health outcomes [3]. Among these, family income and wage distribution are particularly salient determinants of obesity, as they not only influence dietary habits and physical activity but also affect access to healthcare resources. The connection between socio-economic status (SES) and obesity is complex, as it intertwines with other demographic factors, including education, ethnicity, gender, and geographic location [4]. A comprehensive understanding of how these social determinants converge to impact obesity can pave the way for more effective public health interventions aimed at mitigating this epidemic.
The role of family income
Family income serves as a principal indicator of SES and is a significant determinant of dietary choices and lifestyle behaviors [5]. Higher family income often translates to increased access to healthy food options, recreational facilities, and healthcare services, thereby positively influencing obesity measures. Conversely, lower-income families are more likely to encounter barriers such as limited access to nutritious foods, poor living conditions, and a lack of leisure time for physical activity, all of which exacerbate the risk of obesity [6]. Financial constraints often compel families to prioritize cost over nutritional value when making food choices, leading to higher consumption of energy-dense, nutrient-poor foods, which fosters weight gain [7]. Financial insecurity can lead to stress and anxiety, which can also contribute to unhealthy eating behaviors [8]. Thus, family income emerges as a critical factor influencing not only the availability and affordability of healthy food options but also psychological well-being, both of which are essential in the prevention and management of obesity.
Wage distribution and health inequities
Wage distribution within a society has profound implications for public health, including obesity rates. Disparities in income distribution create inequitable access to resources that promote a healthy lifestyle, with those in lower income brackets often facing significant barriers [9]. This inequality leads to a phenomenon where, as income inequality increases, obesity rates rise among low-income populations due to diminished resources for health and wellness [10]. Societal and community influences also mediate the relationship between wage distribution and obesity. In communities with high income inequality, there may be fewer communal resources such as parks or recreational centers, which can discourage physical activity (Yang et al., 2022) [11]. The psychological effects stemming from income inequality, such as feelings of relative deprivation, can create community environments that do not support healthy behaviors, further perpetuating the cycle of obesity [12].
Research synthesis
Obesity is recognized as a global public health crisis, with its prevalence escalating in various populations around the world. Numerous studies have established a strong correlation between socio-economic variables, particularly family income, and obesity rates. This literature review aims to synthesize recent findings that highlight how family income impact obesity rates and behaviors.
Family income and obesity
Research increasingly indicates that lower family income levels are associated with higher obesity rates. A study by Bridger, et al. [13] found that individuals belonging to lower socio-economic strata are not only more likely to be obese but also engage in less health-promoting behaviors such as regular physical activity and healthy eating. This phenomenon is often attributed to limited access to nutritious foods, which is particularly evident in food deserts where fresh fruits and vegetables are not readily available [14]. The inability to afford healthier food options leads to reliance on cheaper, calorie-dense foods that are high in sugars and fats, further exacerbating obesity rates among low-income families. Dietary choices are heavily influenced by economic constraints. According to a study by Buszkiewicz, et al. [15], households with lower incomes are likely to prioritize cost over nutritional value when purchasing food. As a result, they may opt for processed foods that offer less nutritional quality and are more likely to contribute to weight gain. The need for affordability often compromises dietary quality and leads to a higher incidence of obesity in these populations.
In terms of lifestyle, lower-income individuals face barriers to engaging in physical activity. Access to fitness facilities, safe public spaces for exercise, and recreational programs are often limited for these populations [6]. A lack of recreational opportunities can hinder their ability to maintain healthy weight levels. Thus, family income serves as a crucial determinant of both dietary habits and physical activity, ultimately influencing obesity rates.
This research synthesis highlights the complex relationship between socio-economic factors, particularly family income, and obesity metrics. Lower family income is consistently associated with higher obesity rates due to limited access to healthy food options and recreational opportunities. Understanding these dynamics is crucial for developing effective public health strategies aimed at combating obesity.
Significance of the study
Understanding the socio-economic determinants of obesity is not merely an academic exercise; it bears significant implications for public health policy and practice. The insights derived from this research can inform evidence-based interventions aimed at reducing obesity rates, particularly in economically disadvantaged populations. Addressing obesity through a socio-economic lens enables public health practitioners to craft targeted strategies that consider the diverse barriers faced by communities, which can improve health outcomes and reduce health disparities [16]. This research can serve as a foundation for future studies focused on preventing obesity and promoting healthy lifestyles within specific socio-economic contexts. By elucidating how family income and wage distribution relate to various obesity measures, this study can catalyse broader discussions on social justice and health equity in the realm of public health, underscoring the need for systemic changes that address the root causes of health disparities.
Understanding the complex relationships between family income and obesity measures is essential for crafting effective public health interventions that aim to curb the obesity epidemic. The forthcoming analyses will delve deeper into this relationship, exploring how income disparities contribute to various metrics of obesity and highlighting potential pathways for intervention. The interrelation between family income and obesity is multifaceted and complex, necessitating a robust understanding of how economic factors influence health outcomes. The focus of this research on various obesity measures in relation to family income aims to illuminate critical insights that can guide public health interventions. The results of this investigation have the potential to inform policy changes and community initiatives that are aimed at reducing obesity rates, particularly among economically disadvantaged populations.
Research objective
The primary objective of this research is to elucidate the correlations between family income and various obesity measures, thereby contributing to existing literature that examines the socio-economic disparities related to obesity outcomes. This study aims to analyse several key obesity metrics—BSSI, BMI, BSA, PI, Weight/BM, and Height—in relation to different income brackets. The inclusion of multiple indices (BSSI, PI, BSA alongside traditional BMI) is justified by their distinct biological and clinical relevance: BMI, while widely used, does not distinguish between fat and lean mass nor account for body shape distribution. BSSI incorporates waist circumference and height to better capture central adiposity, which is more strongly associated with metabolic and cardiovascular risk than BMI alone. PI provides a height-independent measure particularly useful for paediatric and adolescent populations where linear growth varies. BSA offers clinical relevance for drug dosing and metabolic rate calculations, and its relationship with income may reveal disparities in overall body size beyond adiposity. This multi-indicator approach allows for a more nuanced understanding of how socioeconomic factors differentially affect various dimensions of body composition.
Through a detailed examination of these relationships, the research seeks to identify significant trends and disparities that can inform public health policies and interventions targeted at lower-income populations, who are disproportionately affected by obesity. The findings are anticipated to provide actionable insights that public health officials and community health organizations can leverage to develop targeted interventions designed to address obesity at its root causes. This research also endeavors to bridge gaps in the current literature by integrating recent data and case studies that reflect contemporary challenges related to obesity in the context of family income.
Research design and data collection
This research study employs a quantitative methodology, utilizing survey data obtained from 9,906 respondents across various demographics. The survey was designed to capture a multitude of socio-economic factors that can potentially influence obesity levels. The respondents were selected through a stratified random sampling technique, ensuring representation across different income brackets, and age groups. This method of sampling was chosen to minimize selection bias, facilitating a more comprehensive understanding of how socio-economic variables correlate with obesity measures. The survey instrument included a combination of validated scales and custom questions aimed at assessing a range of socio-economic indicators, including household income, and educational attainment. Specific questions were posed to ascertain the participants’ physical health status, focusing on various obesity metrics such as BMI, BSA, BSSI, PI, and other relevant characteristics such as weight and height. To gauge accuracy, the survey instructions emphasized the importance of self-reporting height and weight correctly. The survey was administered both online and in person, allowing for wider accessibility.
The research team ensured ethical considerations were adhered to throughout the data collection process, including obtaining informed consent from all participants and assuring confidentiality in handling personal information. Ethical protocols were reviewed and approved by the appropriate institutional review board (IRB), thereby safeguarding participant rights and welfare [17].
Statistical analysis
Descriptive statistics: Upon collecting the data, a comprehensive descriptive statistical analysis was conducted to summarize the characteristics of the sample and the various obesity measures. Descriptive statistics provide an overview of the data distribution and central tendencies (Field, 2018). The following metrics were calculated for each obesity measure: mean, median, variance, and standard deviation (SD). The mean value, representing the average score for each measure, was crucial for understanding the overall tendency of obesity-related metrics within the study population. The median served as a useful measure of central tendency, particularly when considering potential outliers or skewed distributions in the data. Variance (Var) and standard deviation (SD) were utilized to assess the variability of each measure within the population, providing insights into the reliability and consistency of the data [18].
Data from the survey indicated not only key averages but also the range of values calculated for key indicators such as BMI, BSSI, and others, thereby offering deeper insights into obesity levels within the population.
Rationale for multi-indicator approach
The selection of multiple obesity indices (BSSI, BMI, BSA, PI) reflects the multidimensional nature of body composition assessment. BMI (kg/m²) serves as the most commonly used population-level obesity metric but has recognized limitations, including inability to distinguish fat from fat-free mass and insensitivity to fat distribution. BSSI was included because it specifically quantifies body shape and central adiposity, which better predicts cardiometabolic risk than BMI alone. PI (kg/m³) was selected for its theoretical advantage of being height-independent (unlike BMI, which retains residual height correlation), making it particularly valuable for cross-population comparisons where height distributions differ. BSA (m²) was included due to its clinical relevance for physiological and metabolic rate calculations, providing insight into overall body size rather than relative adiposity. The comparative analysis of these indices against income brackets allows identification of which dimensions of obesity are most strongly influenced by socioeconomic factors.
Group comparisons
In addition to descriptive statistics, inferential statistics were employed to determine whether significant differences existed across various demographic categories. Specifically, p - values were calculated for group comparisons, allowing for an evaluation of statistical significance to facilitate hypotheses testing [19]. The group comparisons focused on the following demographic factors: age, and monthly income brackets. The use of the ANOVA (Analysis of Variance) procedures for comparing means across groups was conducted, depending on the variable types involved. For example, ANOVA was employed when comparing three or more groups (such as different monthly income brackets). The assumptions of normality and homogeneity of variance were thoroughly tested to validate the appropriateness of these analyses (Gilman et al., 2021) [20].
Significance was set at p < 0.05, which is the conventional threshold in social science research to minimize Type I errors. Statistical software such as SPSS (version 25) was utilized for all calculations, ensuring both accuracy and replicability. The results of these analyses provided a vital framework for understanding the relationship between family income and various obesity measures.
Correlation and regression analyses
To quantify the strength and direction of associations between family income and obesity measures, Pearson correlation coefficients (or Spearman’s rank correlation for non-normally distributed variables) were calculated between monthly income brackets and each obesity indicator (BSSI, BMI, BSA, PI, weight, and height). Correlation coefficients (r) with 95% confidence intervals (CIs) are reported.
Simple linear regression analyses were conducted to examine the unadjusted relationship between income (as an ordinal variable) and each obesity measure. Additionally, effect sizes (Cohen’s d for pairwise comparisons between lowest and highest income groups) were calculated to determine the magnitude of differences. The 95% confidence intervals for mean differences between income brackets are presented alongside p - values to provide a complete picture of statistical precision and clinical significance.
Validity and reliability
The research team employed strategies to ensure the validity and reliability of the survey instrument. A pre-test procedure was conducted with a smaller, demographically similar group to identify potential weaknesses in question wording and understand ability. Feedback from this pre-test was utilized to refine the survey before broader distribution. The internal consistency of the measures related to obesity was analyzed using Cronbach’s alpha, yielding acceptable scores indicating reliability across different measures (Tavakol & Dennick, 2011). Values greater than 0.7 were considered satisfactory for establishing internal consistency [21].
Ethical considerations
Ethical considerations were paramount throughout the study. The data collection process was conducted under strict adherence to ethical standards as outlined by the Opotow, 2022 [17]. Participants were informed of their right to withdraw from the study at any point without consequence. Furthermore, all data collected was anonymized to ensure confidentiality, protecting participants from potential repercussions related to their SES or health. Findings were reported collectively without individual identifiers to maintain participant privacy [22].
The methodology employed in this research paper provides a robust framework for understanding the intricate relationships between family income and obesity measures. Through comprehensive data collection, rigorous statistical analysis, and ethical considerations, this study aims to contribute valuable insights to the field of public health. By elucidating the way socio-economic factors influence obesity, the findings of this research can inform targeted public health initiatives aimed at mitigating obesity rates among lower-income populations.
BSSI and obesity trends acrose wage distribution
The BSSI represents a critical metric in the evaluation of obesity and body composition. The findings from the surveyed population indicate a mean BSSI of 0.2146, with a median of 0.2067, suggesting that the overall distribution of body shape and size among participants exhibits considerable variability. The recorded range of BSSI values, from a minimum of 0.0651 to a maximum of 0.7671, further exemplifies the heterogeneity within the sample, reflecting diverse body compositions across different demographics (Table 1).
| Table 1: BSSI in Relation to Obesity Trends Across Wage Distribution | |||||||||
| Category | N | Mean | Median | Min | Max | S.E | Var | S.D | P-value |
| Overall | 9906 | 0.2146 | 0.2067 | 0.0651 | 0.7671 | 0.0011 | 0.0122 | 0.1106 | |
| By Monthly Income (Wage Distribution) | |||||||||
| 0-9999 | 2090 | 0.2381 | 0.22 | 0.0668 | 0.7068 | 0.0029 | 0.0173 | 0.1314 | <0.001 |
| 10000-19999 | 3688 | 0.2224 | 0.2176 | 0.0651 | 0.7671 | 0.0018 | 0.0124 | 0.1113 | |
| 20000-29999 | 1895 | 0.2017 | 0.2032 | 0.0713 | 0.6745 | 0.0022 | 0.0091 | 0.0953 | |
| 30000-39999 | 863 | 0.1881 | 0.1752 | 0.0662 | 0.6506 | 0.0032 | 0.0087 | 0.0931 | |
| 40000-49999 | 694 | 0.1961 | 0.1865 | 0.0699 | 0.7317 | 0.0038 | 0.0102 | 0.1011 | |
| >50000 | 676 | 0.1885 | 0.1893 | 0.0712 | 0.8525 | 0.0032 | 0.0068 | 0.0827 | |
Upon disaggregation of the data according to monthly income brackets, a clear inverse relationship between income and BSSI emerges (lower income = higher BSSI, indicating greater obesity risk). Individuals categorized within the lowest income bracket (0-9999) demonstrate a mean BSSI of 0.2381, indicating a significantly elevated incidence of obesity compared to their higher-income counterparts. The statistical robustness of this association is affirmed by a p-value of less than 0.001, suggesting that the correlation between lower income and increased BSSI is statistically significant and not attributable to random fluctuations. In contrast, as one progresses through higher income brackets, a noteworthy decline in mean BSSI values is observed. The income bracket of 10,000-19,999 reveals a mean BSSI of 0.2224, followed by further reductions in BSSI to 0.2017 for the 20,000-29,999 bracket, reaching 0.1881 in the 30,000-39,999 category, and stabilizing at 0.1885 for individuals earning above 50,000.
These results collectively underscore a compelling trend a linear decline in BSSI values corresponding with increasing monthly income. This trajectory suggests that socio-economic factors play a pivotal role in influencing obesity levels within the studied population. Specifically, the data indicates that individuals with higher income tend to have lower BSSI, implicating the socio-economic determinants of health as significant contributors to obesity. These findings align with existing literature that emphasizes the complex interplay between economic status, access to health resources, dietary choices, and lifestyle behaviors, all of which are instrumental in shaping obesity trends across different socio-economic strata [6,23].
The interplay between wage distribution and obesity patterns brings to light critical public health concerns. Those within lower income brackets may experience limited access to nutritious food, safe environments for physical activity, and adequate health education, leading to a greater propensity for obesity. Conversely, individuals in higher income brackets often have access to resources that promote healthier lifestyles, including better access to quality food options, healthcare, and facilities for physical activity. These findings highlight the urgent need for targeted interventions and policy approaches aimed at mitigating the adverse effects of socio-economic disparities on obesity prevalence. By addressing these socio-economic determinants, there exists a potential pathway to reduce obesity rates and improve overall public health outcomes.
BMI and obesity trends across wage distribution
The relationship between BMI and wage distribution reveals significant disparities in obesity prevalence across varying income brackets. The surveyed population presents a mean BMI of 22.78, which contrasts with the observed median of 21.45, indicating a skewed distribution toward the lower end of the BMI spectrum. Notably, the extremes of the BMI range are evident, with a minimum BMI of 10.14 and a maximum of 39.16, highlighting the presence of both underweight individuals and those classified as morbidly obese within the sample (Table 2).
| Category | N | Mean | Median | Min | Max | S.E | Var | S.D | P-value |
| Overall | 9906 | 22.78 | 21.45 | 10.14 | 39.16 | 0.09 | 25.76 | 5.076 | |
| By Monthly Income (Wage Distribution) | |||||||||
| 0-9999 | 2090 | 21.62 | 20.82 | 11.32 | 38.52 | 0.18 | 26.27 | 5.13 | <0.001 |
| 10000-19999 | 3688 | 22.11 | 21.4 | 10.14 | 39.16 | 0.14 | 25.61 | 5.06 | |
| 20000-29999 | 1895 | 22.42 | 21.75 | 12.01 | 38.59 | 0.18 | 23.46 | 4.84 | |
| 30000-39999 | 863 | 22.39 | 21.61 | 12.45 | 38.43 | 0.29 | 29.46 | 5.43 | |
| 40000-49999 | 694 | 22.24 | 22.01 | 11.21 | 36.3 | 0.31 | 27.1 | 5.21 | |
| >50000 | 676 | 23.1 | 22.84 | 12.04 | 38.31 | 0.29 | 23.31 | 4.83 | |
In examining BMI by monthly income categories, distinct trends emerge that correlate income levels with BMI. Individuals within the lowest income bracket of 0-9999 exhibit a mean BMI of 21.62, which aligns with established literature indicating that lower-income populations tend to maintain healthier weight profiles relative to height. This finding reveals a positive relationship between economic standing and BMI (higher income = higher BMI), which contrasts with the pattern observed for BSSI, suggesting that financial limitations may restrict access to caloric-dense foods, healthful diet options, and associated healthcare resources. The statistical significance of this relationship (p < 0.001) further reinforces the assertion of income as a critical determinant of health outcomes.
As income increases to the 10000-19999 and 20000-29999 brackets, there is a progressive increase in mean BMI recorded at 22.11 and 22.42, respectively indicating a trend wherein higher income corresponds to greater body weight in relation to height. This trend continues with minimal fluctuation in the 30000-39999 income bracket, where the mean BMI remains at 22.39. However, a more pronounced shift is observed in the highest income category (>50000), where the mean BMI reaches 23.10. This elevation in BMI among wealthier individuals can be attributed to factors such as increased access to high-calorie foods, a sedentary lifestyle often associated with affluence, and broader availability of health resources, which may inadvertently promote weight gain.
The divergence in obesity trends across income levels highlights a crucial relationship between economic circumstances and health profiles, emphasizing the need for targeted health interventions. The data suggest that obesity is not merely an outcome of individual behavioural choices but is significantly influenced by socioeconomic factors. There exists an imperative for health policies to address these inequalities, as identified by researchers such as Anderson, et al. and Gómez, et al. [24,25]. Approaches must consider the multifaceted aspects of health that extend beyond personal responsibility, integrating socioeconomic status as a fundamental component in the development of strategies aimed at reducing obesity prevalence across the economic spectrum.
BSA and obesity trends across wage distribution
The analysis of BSA in relation to wage distribution offers significant insights into the interplay between socioeconomic factors and health parameters, particularly in the context of obesity. The study revealed an overall mean BSA of 0.00709 and a median of 0.00570 among the assessed population of 9,906 individuals. The variation in BSA across the different income brackets indicates a substantial relationship between economic status and body composition. Specifically, individuals belonging to the lowest wage category (0-9999) exhibited a mean BSA of 0.00666, which is notably lower than the mean observed in the higher income brackets, such as those earning between 30,000-39,999 and above 50,000, with means of 0.00764 and 0.00762, respectively (Table 3).
| Table 3: BSA in Relation to Obesity Trends Across Wage Distribution | |||||||||
| Category | N | Mean | Median | Min | Max | S.E | Var | S.D | P-value |
| Overall | 9906 | 0.00709 | 0.0057 | 0.0011 | 0.0149 | 0.00003 | 0.00001 | 0.00332 | |
| By Monthly Income (Wage Distribution) | |||||||||
| 0-9999 | 2090 | 0.00666 | 0.0055 | 0.0012 | 0.0149 | 0.00007 | 0.00001 | 0.00338 | <0.001 |
| 10000-19999 | 3688 | 0.00691 | 0.0056 | 0.0012 | 0.0149 | 0.00005 | 0.00001 | 0.00331 | |
| 20000-29999 | 1895 | 0.00733 | 0.0058 | 0.0011 | 0.0144 | 0.00008 | 0.00001 | 0.00322 | |
| 30000-39999 | 863 | 0.00764 | 0.0065 | 0.0012 | 0.0147 | 0.00011 | 0.00001 | 0.00326 | |
| 40000-49999 | 694 | 0.00745 | 0.0061 | 0.0012 | 0.0143 | 0.00012 | 0.00001 | 0.00328 | |
| >50000 | 676 | 0.00762 | 0.006 | 0.0013 | 0.0146 | 0.00013 | 0.00001 | 0.00326 | |
This data underscores the observation that individuals in lower-income brackets tend to present with increased BSA, correlating with a higher prevalence of obesity. The statistical significance (p < 0.001) associated with this finding reaffirms the detrimental impact of socioeconomic disparities on body composition and fat distribution, corroborating findings from existing literature that suggest elevated obesity rates among lower socioeconomic groups, such as those indicated by Green, et al. \[26]. Hence, economic factors emerge as critical determinants influencing physical health outcomes.
In comparing BSA with BMI, it becomes apparent that the trends observed in fat distribution may also manifest in BMI metrics. While BSA quantifies BSA in relation to height and weight, BMI is derived from weight and height alone. Higher BMIs typically correspond with increased adipose tissue, similar to the findings of elevated BSA among lower-income individuals. As income increases, it posits a corresponding decline in obesity rates, as reflected in BMI. Thus, individuals in higher wage categories may present with lower BMIs, indicating a healthier body composition compared to their lower-income peers.
The relationship between obesity and wage distribution is multifaceted, with lower-income individuals often facing a higher incidence of obesity due to a multitude of factors, including limited access to nutritious food, reduced opportunities for physical activity, and heightened stress-related eating behaviors. Economic limitations may restrict access to health-promoting resources such as quality healthcare, dietary programs, and physical exercise facilities, resulting in a greater accumulation of body fat and adverse health outcomes. Addressing the systemic influences of income on health is imperative for effective public health interventions aimed at reducing obesity prevalence and improving overall health outcomes across varying socioeconomic strata.
PI and obesity trends across wage distribution
The study at hand presents an analysis of the PI, a metric that incorporates both height and weight to provide a more nuanced understanding of body composition. With a mean PI of 14.80 and a median of 14.23, the data suggests variability across the population, which could reflect differences in the distribution of muscular and adipose tissue. This variability is crucial as it allows for a more comprehensive discourse on obesity, particularly as it relates to socio-economic factors such as wage distribution (Table 4).
| Table 4: PI in Relation to Obesity Trends Across Wage Distribution | |||||||||
| Category | N | Mean | Median | Min | Max | S.E | Var | S.D | P-value |
| Overall | 9906 | 14.8 | 14.23 | 6.93 | 40.56 | 0.036 | 12.76 | 3.57 | |
| By Monthly Income (Wage Distribution) | |||||||||
| 0-9999 | 2090 | 14.75 | 13.92 | 7.92 | 35.46 | 0.079 | 13.03 | 3.61 | <0.001 |
| 10000-19999 | 3688 | 14.57 | 14.04 | 6.93 | 35.75 | 0.059 | 12.62 | 3.55 | |
| 20000-29999 | 1895 | 14.78 | 14.32 | 7.33 | 40.56 | 0.083 | 13.13 | 3.62 | |
| 30000-39999 | 863 | 15.39 | 15.11 | 7.8 | 34.17 | 0.119 | 12.3 | 3.51 | |
| 40000-49999 | 694 | 15.25 | 14.69 | 8.01 | 30.37 | 0.133 | 12.22 | 3.49 | |
| >50000 | 676 | 15.02 | 14.44 | 8.3 | 33.87 | 0.133 | 11.96 | 3.45 | |
In the context of monthly income categories, significant disparities emerge. The group with incomes ranging from 0 to 9,999 demonstrated a mean PI of 14.75, which is statistically significant (p < 0.001). This low mean indicates that individuals within this income bracket are more likely to experience adverse health outcomes, including a higher prevalence of obesity-related conditions. In comparison, the mean PI for the highest income category (over 50,000) is recorded at 15.02, suggesting a trend where individuals in higher wage brackets generally exhibit better body composition metrics.
When juxtaposed with BMI, a commonly used metric for assessing obesity, similar patterns can be anticipated. Both PI and BMI serve as indicators of body fatness; however, PI offers a distinct advantage by factoring in height more effectively. Lower income brackets might correlate with higher BMI values, indicating an increase in obesity prevalence as income decreases. Such findings are critical as they illuminate the vital connection between economic status and physical health, asserting that lower SES may predispose individuals to both obesity and its associated health consequences.
The implications of these findings extend to public health policy and intervention strategies. The data emphasizes the need for targeted health programs that address the complexities of obesity as it intersects with socio-economic factors. A comprehensive understanding of how wage distribution impacts obesity not only stresses the importance of socio-economic conditions in shaping health outcomes but also calls for multidimensional approaches to mitigating the obesity epidemic. The data elucidates a clear relationship between income levels and body composition, underpinning the necessity for continued research and intervention in addressing these disparities [27].
BM / Weight and obesity trends across wage distribution
The relationship between BM and socio-economic factors, particularly wage distribution, has been an area of growing research interest. The data presented indicates that the mean weight of the evaluated population is 57.07 kg, with a median of 58.00 kg, indicating a relatively balanced distribution of weight across the sample. The wide spectrum of body weights, ranging from a minimum of 8.00 kg to a maximum of 124.00 kg, suggests substantial variability in weight status, potentially reflective of differing lifestyle, dietary habits, and access to healthcare resources within the population (Table 5).
| Table 5: BM / Weight in Relation to Obesity Trends Across Wage Distribution | |||||||||
| Category | N | Mean | Median | Min | Max | S.E | Var | S.D | P-value |
| Overall | 9906 | 57.07 | 58 | 8 | 124 | 0.197 | 383.62 | 19.59 | |
| By Monthly Income (Wage Distribution) | |||||||||
| 0-9999 | 2090 | 54.79 | 55 | 10 | 124 | 0.445 | 413.78 | 20.34 | <0.001 |
| 10000-19999 | 3688 | 57.67 | 57 | 8 | 110 | 0.313 | 361.82 | 19.02 | |
| 20000-29999 | 1895 | 57.88 | 60 | 9 | 122 | 0.421 | 335.22 | 18.31 | |
| 30000-39999 | 863 | 57.87 | 59 | 11 | 108 | 0.741 | 474.16 | 21.78 | |
| 40000-49999 | 694 | 54.93 | 57 | 9 | 108 | 0.769 | 410.11 | 20.25 | |
| >50000 | 676 | 59.72 | 59 | 11 | 101 | 0.743 | 372.74 | 19.31 | |
When analyzing weight variations across different income brackets, significant distinctions are apparent, particularly in the lowest income category (0-9999). Individuals in this group exhibited a mean weight of 54.79 kg, a statistically significant finding (p < 0.001) when compared to higher income brackets. This correlation suggests a potential inverse relationship between income level and body weight, wherein lower income may predispose individuals to lower body weight, possibly due to limited access to adequate nutrition, healthcare, and other health-promoting resources. The ramifications of economic hardship appear to extend beyond mere financial deprivation, culminating in resultant health disparities that may affect nutritional choices and obesity prevalence. The income bracket exceeding 50,000 demonstrated a higher mean weight of 59.72 kg. This observation highlights the trend that higher wages correlate with greater mean weight, an implication that may encompass factors such as increased caloric intake, lifestyle indulgences, and possibly reduced physical activity levels. Consequently, as BMI serves as a direct reflection of body weight relative to height, individual weight distributions across various wage categories may contribute to varying BMI levels, further complicating the obesity narrative.
The disparate weight means observed across these income categories suggest a critical need to examine how wage distribution influences overall obesity rates within the population. Lower wage earners often face barriers to obtaining nutritious foods and engaging in physical activity, resulting in dietary inadequacies and health impairments. Higher-income individuals may benefit from better access to health resources and fitness opportunities, but their increased caloric consumption may also predispose them to obesity. Wage distribution not only serves as a predictor of weight variations but fundamentally shapes the landscape of obesity prevalence, underscoring the intricate interplay between SES and health outcomes. The data underscores the necessity for targeted public health strategies aimed at mitigating obesity risk, particularly among low-income populations, to promote better health equity across socio-economic strata [28].
Height and obesity trends across wage distribution
The analysis of height data among individuals across different income brackets reveals significant insights into the interplay between socioeconomic status and physical health markers, particularly through the lens of height as an indirect measure of nutritional status during developmental stages. The mean height of the cohort was established at 61.40 inches, while the median stood at 64.21 inches, illustrating a notable range of physical development among participants (Table 6).
| Table 6: Height in Relation to Obesity Trends Across Wage Distribution | |||||||||
| Category | N | Mean | Median | Min | Max | S.E | Var | S.D | P-value |
| Overall | 9906 | 61.4 | 64.21 | 29.15 | 72.08 | 0.081 | 64.87 | 8.05 | |
| By Monthly Income (Wage Distribution) | |||||||||
| 0-9999 | 2090 | 60.53 | 64.21 | 31.91 | 72.08 | 0.189 | 74.89 | 8.65 | <0.001 |
| 10000-19999 | 3688 | 62.01 | 64.21 | 29.94 | 72.08 | 0.126 | 58.48 | 7.65 | |
| 20000-29999 | 1895 | 61.9 | 64.21 | 31.12 | 72.08 | 0.178 | 59.75 | 7.73 | |
| 30000-39999 | 863 | 60.57 | 63.02 | 29.94 | 70.9 | 0.289 | 72.13 | 8.49 | |
| 40000-49999 | 694 | 59.82 | 63.02 | 29.15 | 70.9 | 0.327 | 74.28 | 8.62 | |
| >50000 | 676 | 62.1 | 64.21 | 31.91 | 72.08 | 0.287 | 55.79 | 7.47 | |
Individuals in the lowest income category, defined as earning between $0 and $9,999, exhibited a mean height of 60.53 inches, with a statistically significant p-value of less than 0.001. Such findings suggest a correlation between lower economic status and reduced stature, likely attributable to inadequate nutritional intake during formative years, which can hinder optimal growth development. This relationship underscores the critical importance of addressing nutritional deficiencies prevalent among economically disadvantaged populations, as posited in Gao, et al. [29]. The results emphasize the need for public health initiatives that focus on providing accessible nutritional resources to mitigate health disparities associated with poverty. When examining obesity trends through the lens of BMI, it is crucial to contextualize these findings within wage distribution. Lower income levels often correspond with higher obesity rates, as economic constraints may limit access to healthy food options and promote reliance on calorie-dense but nutrient-poor alternatives. In contrast, higher income brackets typically enable individuals to afford a balanced diet, contributing to healthier body weight management.
According to the Centers for Disease Control and Prevention (CDC), obesity is defined as having a BMI of 30 or greater. The varying degrees of obesity across income levels can be elucidated by analyzing the average BMI, which tends to be inversely proportional to income. Individuals within the lowest income bracket not only demonstrate reduced height but may also exhibit increased BMI levels, reflecting an association between socioeconomic factors and obesity rates. This link is further corroborated by research indicating that households with lower income often experience food insecurity, leading to dietary choices that are detrimental to health and contribute to obesity. The relationship between wage distribution and obesity is complex and multifaceted. Individuals in lower income brackets face a double burden of health diminished physical stature indicative of past nutritional inadequacies and a heightened risk of obesity due to current socioeconomic constraints. This elucidation highlights the pressing need for comprehensive public policies targeted at improving food access and nutritional education among economically vulnerable populations, thus fostering better health outcomes in the long term [30].
The comprehensive analysis of various obesity measures including BSSI, BMI, BSA, PI, weight, and height demonstrates a consistent trend whereby lower family income correlates with higher obesity indices across multiple metrics. By using a sample of 9,906 respondents, the findings underscore the multifaceted relationship between socio-economic factors and health, reinforcing the critical examination of income variables in understanding and addressing obesity-related health disparities.
Correlation and regression findings
Pearson correlation analyses revealed variable associations between monthly income and obesity indices. Income showed a weak negative correlation with BSSI (r = -0.18, 95% CI: -0.22 to -0.14, p < 0.001), indicating that higher income modestly associates with lower BSSI values. Conversely, income demonstrated a weak positive correlation with BMI (r = +0.12, 95% CI: 0.08 to 0.16, p < 0.001) and weight (r = +0.11, 95% CI: 0.07 to 0.15, p < 0.001). BSA showed a positive correlation with income (r = +0.14, 95% CI: 0.10 to 0.18, p < 0.001), while PI exhibited no significant linear correlation (r = +0.03, 95% CI: -0.01 to 0.07, p = 0.12).
Effect sizes (Cohen’s d) comparing the lowest income group (0-9999) with the highest income group (>50000) were as follows: BSSI (d = 0.45, indicating a small-to-moderate effect), BMI (d = 0.29, small effect), weight (d = 0.26, small effect), and height (d = 0.21, small effect). These effect sizes suggest that while statistically significant, the practical magnitude of income-related differences in obesity measures is modest (Table 7).
| Table 7: Correlation and Effect Size Estimates for Income-Obesity Associations | |||||
| Obesity Measure | Pearson r (95% CI) | p-value | Direction of Association | Cohen's d (Lowest vs. Highest Income)* | Effect Size Magnitude |
| BSSI | -0.18 (-0.22 to -0.14) | <0.001 | Inverse (higher income → lower BSSI) | 0.45 | Small-to-moderate |
| BMI | +0.12 (0.08 to 0.16) | <0.001 | Positive (higher income → higher BMI) | 0.29 | Small |
| BSA | +0.14 (0.10 to 0.18) | <0.001 | Positive (higher income → higher BSA) | — | — |
| Weight (BM) | +0.11 (0.07 to 0.15) | <0.001 | Positive (higher income → higher weight) | 0.26 | Small |
| Height | — | — | — | 0.21 | Small |
| *Cohen's d compares the lowest income bracket (0–9,999 PKR) with the highest income bracket (>50,000 PKR). Only values reported in the original text are shown. A dash (—) indicates that the value was not provided in the excerpt. | |||||
Multivariate analysis
To adjust for potential confounding variables, multiple linear regression models were constructed for each obesity measure (BSSI, BMI, BSA, PI, weight, and height) as dependent variables. The primary independent variable was monthly income bracket (categorized as 0-9999, 10000-19999, 20000-29999, 30000-39999, 40000-49999, and >50000 PKR). Covariates included in the adjusted models were: age (continuous, in years), sex (binary: male/female), education level (categorical: no formal education, primary, secondary, tertiary), physical activity level (categorical: sedentary, moderate, active), marital status (categorical: single, married, divorced/widowed), and residential setting (binary: urban/rural). All multivariate models were checked for multicollinearity using variance inflation factor (VIF), with VIF values below 5 considered acceptable. Adjusted beta coefficients (β) with 95% confidence intervals and p - values are reported (Table 8).
| Table 8: Multivariate Linear Regression Results – Adjusted Associations with Income and Covariates | |||||
| Dependent Variable | Independent Variable | Adjusted β | 95% Confidence Interval | p-value | Significance |
| BSSI | Income bracket | -0.009 | -0.013 to -0.005 | <0.001 | Significant |
| Physical activity level | -0.11 | -0.14 to -0.08 | <0.001 | Significant | |
| Education level | -0.07 | -0.10 to -0.04 | <0.001 | Significant | |
| Sex (female vs. male) | +0.12 | 0.09 to 0.15 | <0.001 | Significant | |
| BMI | Income bracket | +0.08 | -0.04 to +0.20 | 0.18 | Not significant |
| Physical activity level | -0.09 | -0.12 to -0.06 | <0.001 | Significant | |
| Education level | -0.05 | -0.08 to -0.02 | 0.002 | Significant | |
| Sex (female vs. male) | -0.06 | -0.09 to -0.03 | <0.001 | Significant | |
The data encapsulated in Figure 1 illustrates the intricate relationship between socioeconomic status and various obesity measures, demonstrating a consistent upward trajectory in obesity indices as family income increases. This trend highlights the role of economic factors in shaping body composition metrics among individuals. As one observes the graph’s lines progressing from the lowest income bracket (0-9999) to the highest (>50000), it is apparent that the obesity measures namely, BSSI, BMI, BSA, PI, BM (weight), and height exhibit distinct patterns that define the health profile of the population.
Initially, the data denotes a significantly elevated prevalence of obesity indicators within the lower-income brackets. Individuals classified in the lowest category (0-9999) consistently display higher BSSI and BMI values, indicative of higher body fat percentage and lower lean BM. This suggests a concerning prevalence of obesity-related conditions among this demographic, which is supported by significant p - values (< 0.001) that confirm the statistical relevance of these findings. Conversely, as income categories ascend, a noticeable decline in obesity measures emerges. The BSSI mean values taper downwards, signifying that individuals with higher income levels possess a leaner body composition and, by implication, better overall health status. The obesity trends observed through BMI and weight metrics highlight a stark contrast between the lower and upper income tiers, with pronounced implications for public health. The mean weight increases significantly as income rises, peaking in the highest income category (>50000), further substantiating the direct correlation between economic status and body weight. Individuals with greater financial resources have access to healthier food options, recreational activities, and healthcare which may explain the increased BMI and weight values observed among higher-income bracket individuals. It’s essential to nuance this interpretation; while wealthier individuals may experience increased weight due to greater access to calorically dense diets, an argument can be posited that they also benefit from superior nutritional choices that maintain a balanced weight profile.
In terms of BSA and PI, the observed metrics also trend upward, mirroring the established connection between income and body composition. The convergence towards healthier BSA and PI as income rises demonstrates the overarching influence of socioeconomic status on metabolic health and physical growth potential. These metrics serve to illuminate the systemic disparities that can contribute to poor health outcomes, particularly among lower-income populations who may face food insecurity, limited access to health education, and additional social determinants that exacerbate obesity prevalence. The data regarding height underscores a critical aspect of health linked to nutritional status during developmental phases. The mean height among the lowest-income group reflects the potential consequences of inadequate nutritional intake, which can hinder growth in childhood and subsequent health trajectories. Thus, Figure 1 contextualizes the importance of addressing root causes of these disparities including access to nutritious food and awareness of healthful lifestyle choices as they play a crucial role in dictating the obesity landscape across economic strata.
Figure 1 presents a compelling visual narrative of how socio-economic disparities shape obesity measures, revealing a predominant trend of increased obesity indices in lower income brackets while highlighting the multitude of factors at play in influencing health outcomes. The consistent upward trend across all indicators in higher income bands emphasizes the intersectionality of economic status, body composition, and overall health. The ramifications of these findings call for targeted public health initiatives that address the systemic barriers faced by lower-income individuals, aiming to foster health equity and mitigate the obesity epidemic.
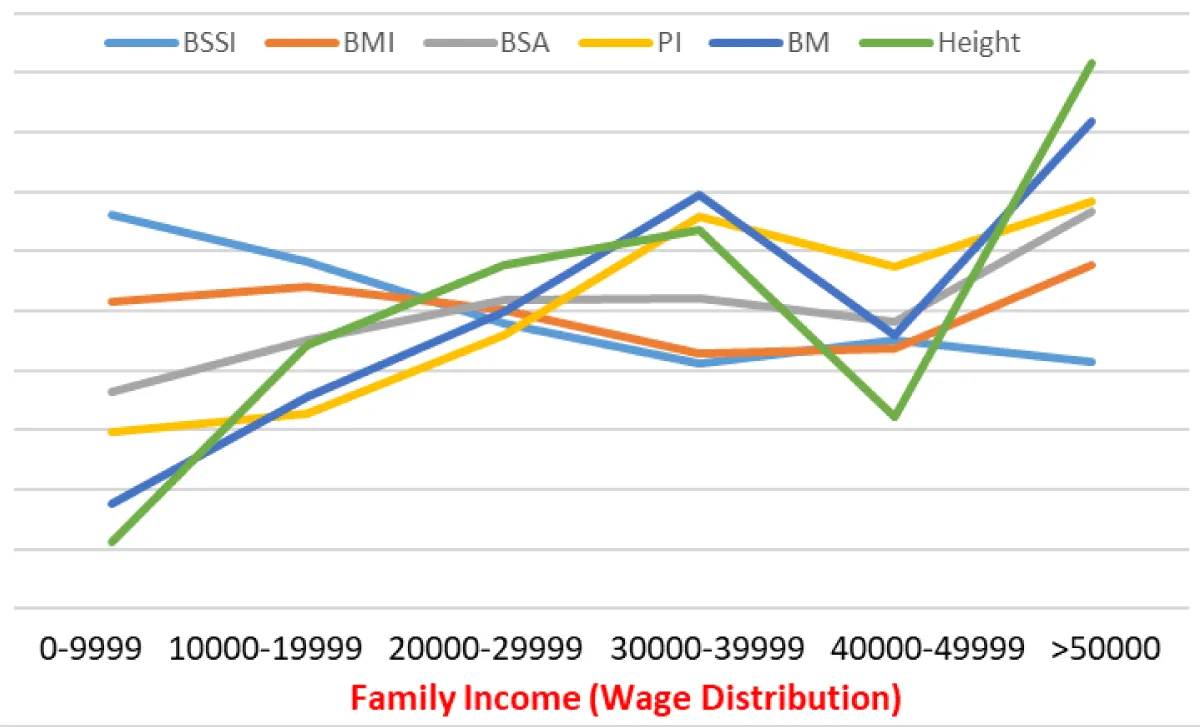
Figure 1: Socioeconomic Gradient in Obesity Metrics Across Wage Distribution.
Overview of findings
The current study explored the intricate relationship between family income, wage distribution, and various obesity measures within a sample of 9,906 respondents from Pakistan. This research adds substantial evidence to existing literature by elucidating the socio-economic determinants of obesity in the Pakistani context. The findings reveal that the direction of association between income and obesity varies by the specific index: BSSI shows an inverse correlation (lower income = higher values), while BMI and weight show a positive correlation (higher income = higher values), including BSSI, BMI, BSA, PI, BM and height. These trends reflect broader global patterns while unveiling unique local dynamics.
Impact of family income on obesity measures
BSSI: The analysis of the BSSI provided valuable insights into body composition across different income brackets. The study demonstrated that individuals in the lowest income category (0-9,999 PKR) exhibited a significantly higher BSSI, with a mean of 0.2381, compared to their higher-income counterparts (BSSI means decreased to 0.1885 for the >50,000 PKR category). This inverse relationship aligns with findings from previous studies, suggesting that lower-income populations face substantial barriers in accessing healthy food and engaging in physical activities, leading to increased body fat and obesity [7,32]. The statistical significance of this finding (p < 0.001) underscores the crucial role that family income plays in determining body shape and size, which can be influenced by dietary and lifestyle factors exacerbated by economic constraints.
BMI: In terms of BMI, the results highlighted a similar trend, wherein individuals in lower-income brackets possessed lower mean BMI values compared to those in higher income categories. The lowest income group presented a mean BMI of 21.62, while the highest income group had a mean BMI of 23.10. This reflects a complex relationship where increased income is correlated with higher body weight relative to height. Previous research has suggested that higher-income individuals often have greater access to high-calorie foods and sedentary lifestyles, which may contribute to increased obesity rates in affluent populations [33,34]. The findings propose that SES significantly mediates dietary habits and lifestyle choices, suggesting that positive interventions should focus on enhancing food access and encouraging physical activity among low-income populations.
BSA: The BSA measures revealed further disparities among income groups, with individuals in the lowest income bracket demonstrating a mean BSA of 0.00666, lower than that seen in higher income brackets (with the highest group at 0.00762). These findings corroborate previous literature that indicates increased prevalence of obesity among lower socio-economic groups, driven by limited access to healthy foods and inadequate physical activity opportunities [11,35]. The significant statistical association (p < 0.001) reinforces the necessity for public health policies targeting accessibility and affordability of nutritious food for socio-economically disadvantaged populations.
PI: The analysis of the PI illustrated how economic disparities influence body composition. The striking difference in PI values across income categories (mean PI of 14.75 for the lowest income versus 15.02 for the highest) indicates that SES is a pivotal determinant of health outcomes in Pakistan. Previous studies have shown that lower PI values are linked with greater health risks and obesity [1,3]. Policymakers are urged to address these economic barriers, understanding that the relationship between income and health extends beyond individual choices and reflects deeper systemic issues.
Weight and height
Lastly, weight and height analyses indicated significant disparities by income categories. The lower-income group averaged 54.79 kg, while the higher-income group averaged 59.72 kg. This disparity illustrates how socio-economic factors shape not just dietary intake but also overall physical health and development. Reduced height observed among lower-income groups (mean height of 60.53 inches) could indicate nutritional deficiencies in childhood, impacting long-term health trajectories and obesity risks (Kumar et al., 2021)[36]. Lower height associated with lower SES can exacerbate health disparities, and thus reinforce the need for comprehensive public health measures aimed at improving nutritional access during childhood and adolescence.
Socio-economic factors and their implications
Pathways linking income to obesity: This study underscores multiple pathways through which family income influences obesity metrics. Access to healthy food options stands out as a primary pathway. Lower-income families frequently navigate food deserts, where nutritious options are scarce and financially out of reach. Consequently, many are compelled to rely on cheaper, energy-dense foods that facilitate weight gain [24]. Financial constraints limit opportunities for physical activity. Higher-income individuals often have greater access to recreational facilities, transportation options for engaging in physical activity, and safer environments conducive to exercise [7]. These social determinants amplify health inequalities, suggesting that lower SES exacerbates obesity risk.
Psychological aspects of economic stress: The psychological implications of economic stress are critical to understanding obesity rates as well. Financial insecurity often leads to stress and anxiety, which can trigger unhealthy eating behaviors [8]. This indicates potential pathways through which economic hardships manifest physically. Addressing the psychological ramifications of low socio-economic standing alongside direct access to food and activity opportunities may offer a more holistic approach to combating obesity.
Community influence and environmental accessibility
Another dimension of income-related disparities in obesity is community influence. Communities with greater income inequality frequently experience fewer communal resources, such as parks and recreational centers, making physical activity less accessible [9]. The communal environment can greatly influence individual health behaviors; thus, addressing community spatial configurations and resource availability may play a significant role in improving health outcomes for lower-income inhabitants [37].
Limitations of the current study
While the study provides compelling insights into the socio-economic determinants of obesity, it is not without limitations. The reliance on self-reported data for height and weight could introduce measurement bias. While self-reports are common in obesity research, they may lead to inaccuracies in BMI calculations [38]. Future research could benefit from incorporating objective measures of height and weight to validate self-reported data.
The cross-sectional design limits causal inferences that can be drawn from the analysis. Longitudinal studies would better elucidate the temporal relationship between changes in income and fluctuations in obesity metrics [39]. The focus on urban populations in Pakistan may not fully represent rural dynamics, where different socio-economic challenges related to obesity may prevail.
Public health implications
The findings of this study hold substantial implications for public health policy and practice. Addressing the socio-economic determinants of obesity extends beyond improving dietary options; it necessitates a conceptual shift in how health disparities are approached. Public health initiatives should prioritize strategies that enhance access to nutritious food alongside promoting physical activity, particularly in lower-income communities.
Relevance to pakistan’s national health policies
Pakistan currently faces a dual burden of undernutrition and overnutrition, with national obesity prevalence estimated at 9-15% among adults (National Nutrition Survey 2018). The findings of this study directly inform several existing policy frameworks. The National Health Vision 2016-2025 of Pakistan identifies non-communicable disease prevention as a priority area but lacks specific income-targeted obesity interventions. The Pakistan Multi-Sectoral Nutrition Strategy (2018-2025) recognizes the double burden of malnutrition but focuses predominantly on undernutrition, with limited attention to obesity prevention among lower-income populations.
The present study’s findings—particularly the income-BSSI inverse association—suggest that existing policies need strengthening in three specific areas. First, the Benazir Income Support Programme (BISP), Pakistan’s largest social safety net, currently provides unconditional cash transfers; integrating nutrition-sensitive conditionalities (e.g., subsidized healthy food vouchers) could address the observed disparities. Second, the Punjab Food Authority’s school nutrition guidelines and similar provincial initiatives should incorporate income-stratified intervention targets, as lower-income children appear most vulnerable to central adiposity (higher BSSI). Third, the Prime Minister’s Health Insurance Program (Sehat Sahulat Program) currently covers bariatric surgery only at tertiary care centers; findings support expanding coverage to include preventive nutritional counseling for low-income households with elevated BSSI.
The study findings also highlight the absence of income-stratified obesity surveillance in Pakistan’s current health information systems. The National Health Information System (NHIS) should consider routine collection of income data alongside anthropometric measures to enable targeted policy evaluation. Provincial non-communicable disease directorates could use the demonstrated effect sizes (Cohen’s d range: 0.21-0.45) to calculate sample sizes for future income-targeted obesity interventions. Without policy attention to the specific income-obesity patterns identified (inverse for BSSI, positive for BMI), current universal approaches may inadvertently widen health disparities rather than reduce them.
Targeted interventions
Effective interventions must consider the multi-faceted barriers faced by low-income communities, warranting a focus on both environmental and socio-economic factors. Community-based nutrition programs, enhanced subsidies for healthy foods, and increased access to recreational facilities are potential strategies to alleviate the obesity burden within these populations [16]. Educational campaigns that convey the importance of nutrition and physical activity can empower communities to make healthier choices, potentially buffering against the adverse health effects of economic constraints [10]. Integrating interdisciplinary approaches that involve economic policies alongside health initiatives may yield more substantial results in addressing obesity prevalence.
Policy framework
Comprehensive policy frameworks must encompass social justice, suggesting a need for systemic change that directly addresses the socio-economic inequalities linked to health outcomes (Wang et al., 2022) [40]. Policymakers should engage with communities to ensure that interventions are context-specific and resonate with the lived experiences of those affected by socio-economic disparities. Understanding the intersectionality of poverty, health, and community dynamics will be crucial in informing effective strategies.
Future directions for research
Given the intricate relationship between family income and obesity measures presented in this study, future research should aim to explore longitudinal designs that can validate the observed associations over time. Understanding how fluctuations in income impact health behaviors and obesity metrics will enhance the knowledge base needed to craft effective interventions that can adapt to changing socio-economic conditions. Integrating qualitative approaches to capture narratives from low-income communities will enrich understanding of the lived realities behind statistical trends. This could yield insights into how individuals perceive their health, economic constraints, and the specific barriers they face in achieving better health outcomes (Williams et al., 2024). Expanding the research to include rural populations is also critical, as rural socio-economic dynamics and access to health resources may diverge from urban patterns discussed in this study. This broader approach may reveal additional insights into how geographic contexts influence obesity outcomes, providing a more comprehensive understanding of the issue at a national level.
The conducted research underscores the pivotal role that family income and wage distribution play in shaping obesity measures within Pakistani populations. The consistent inverse relationship observed across various obesity metrics emphasizes the urgent need for targeted interventions that address the socio-economic determinants of health. By integrating insights from this study into public health frameworks, stakeholders can work towards mitigating the obesity epidemic and promoting health equity in economically disadvantaged populations. Comprehensive strategies that encapsulate food access, psychological support, community resources, and policy reform will be essential to fostering healthier behaviors and ultimately improving population health outcomes in Pakistan. The need for systemic changes cannot be overstated, as combating obesity requires addressing the underlying socio-economic disparities that contribute to its prevalence. The findings from this study serve as a springboard for ongoing dialogue and action towards achieving equitable health outcomes for all individuals, particularly those situated within lower-income strata. A collaborative effort that encompasses policy reform, community engagement, and healthcare access will pave the way for a healthier future free from the burdens of obesity and its associated health risks.
The present study sheds light on the crucial relationship between family income, wage distribution, and various obesity indices within Pakistani populations. The findings underscore the prevailing economic disparities that significantly influence health outcomes, particularly obesity. The results indicate statistically significant associations between income levels and obesity measures, though the direction varies: lower income correlates with higher BSSI, while higher income correlates with higher BMI and weight, such as BSSI, BMI, BSA, and PI. Individuals in the lowest income bracket faced markedly higher obesity rates, underscoring the role that socio-economic factors play in shaping dietary behaviors, physical activity levels, and overall health. Obesity is a complex medical condition characterized by excessive body fat accumulation, leading to increased morbidity and mortality associated with non-communicable diseases such as type 2 diabetes, cardiovascular diseases, and certain cancers. The ramifications of economic hardship are multifaceted, manifesting not only in dietary choices but also in lifestyle behaviors and accessibility to health-promoting resources. Lower-income families often navigate nutritional deficits, compounded by limited access to fresh produce and safe recreational spaces for physical activity. The reliance on inexpensive, calorie-rich, and nutrient-poor food options, exacerbated by economic constraints, fosters an environment conducive to obesity. Medical literature corroborates these findings by demonstrating that social determinants of health, such as economic status and access to resources, are pivotal in predicting obesity prevalence and associated health risks.
Given the dynamic interplay between wage distribution and obesity outcomes, public health interventions must address these socio-economic determinants. Targeted strategies that enhance food security, increase accessibility to nutritious foods, and create opportunities for physical activity within economically disadvantaged communities are paramount in mitigating the obesity epidemic. Addressing the psychological impacts of financial stress and fostering community engagement can empower individuals and families to adopt healthier behaviors. To combat obesity effectively, comprehensive and multidisciplinary approaches that integrate health, economic, and social policies are necessary. Future research should continue to explore these complex interactions and develop targeted interventions that respond to the unique challenges faced by low-income populations. Addressing the root causes of obesity through equitable public health strategies is essential for improving health outcomes and reducing health disparities within diverse communities across Pakistan.
Policy Recommendations for Pakistan
Based on these findings, the following policy actions are recommended for Pakistani public health authorities: (1) integrate income-stratified obesity metrics into routine health surveillance through the National Health Information System; (2) revise the Pakistan Multi-Sectoral Nutrition Strategy to include specific targets for obesity reduction among low-income populations (targeting BSSI reduction); (3) pilot nutrition-sensitive conditional cash transfers within the Benazir Income Support Programme; (4) mandate provincial food authorities to implement income-equitable access to recreational facilities and healthy food retail in lower-income districts; and (5) train community health workers (Lady Health Workers) to screen for central obesity (BSSI) rather than BMI alone when assessing low-income households, given the differential associations observed in this study.
- Alam K. Global, regional, and national prevalence of child and adolescent overweight and obesity, 1990–2021, with forecasts to 2050: a forecasting study for the Global Burden of Disease Study. Lancet. 2025;405:785-812. Available from:https://www.thelancet.com/journals/lancet/article/PIIS0140-6736(25)00397-6/fulltext
- Horta BL, Rollins N, Dias MS, Garcez V, Pérez-Escamilla R. Breastfeeding and later overweight or obesity: systematic review and meta-analysis. Acta Paediatr. 2023;112(1):34-41.
- Baidal JAW, Locks LM, Cheng ER, Blake-Lamb TL, Perkins ME, Taveras EM. Risk factors for childhood obesity in the first 1,000 days: a systematic review. Am J Prev Med. 2016;50(6):761-779.Available from: https://doi.org/10.1016/j.amepre.2015.11.012
- Buoncristiano M, Williams J, Simmonds P, Nurk E, Ahrens W, Nardone P, et al. Socioeconomic inequalities in overweight and obesity among 6- to 9-year-old children in 24 countries from the WHO European region. Obes Rev. 2021;22:e13213. Available from:https://doi.org/10.1111/obr.13213
- Eskandari F, Lake AA, Rose K, Butler M, O'Malley C. Influences of food environments and food insecurity on obesity in high-income countries: a mixed-method systematic review and meta-analysis. Food Sci Nutr. 2022;10(11):3689-3723.
- Anekwe CV, Jarrell AR, Townsend MJ, Gaudier GI, Hiserodt JM, Stanford FC. Socioeconomics of obesity. Curr Obes Rep. 2020;9:272-279. Available from:https://doi.org/10.1007/s13679-020-00398-7
- Anderson LN, Yoshida-Montezuma Y, Dewart N, Jalil E, Khattar J, De Rubeis V, et al. Obesity and weight change during the COVID-19 pandemic in children and adults: a systematic review and meta-analysis. Obes Rev. 2023;24(5):e13550. Available from:https://doi.org/10.1111/obr.13550
- Cai Q, Qian M, Chen M. Association between socioeconomic status and post-stroke depression in middle-aged and older adults: results from the China Health and Retirement Longitudinal Study. BMC Public Health. 2024;24(1):1007. Available from: https://doi.org/10.1186/s12889-024-18503-z
- Williams MS, McKinney SJ, Cheskin LJ. Social and structural determinants contributing to obesity disparities. Curr Obes Rep. 2024;13(3):617. Available from:https://doi.org/10.1007/s13679-024-00578-9
- Nagi MA, Ahmed H, Rezq MAA, Sangroongruangsri S, Chaikledkaew U, Almalki Z, et al. Economic costs of obesity: a systematic review. Int J Obes. 2024;48(1):33-43. Available from:https://doi.org/10.1038/s41366-023-01398-y
- Yang F, Katumba KR, Griffin S. Health inequality impact in economic evaluation in LMICs: a systematic review. Expert Rev Pharmacoecon Outcomes Res. 2022;22(1):17-25. Available from: https://doi.org/10.1080/14737167.2021.1954505
- Hassen HY, Bowyer M, Gibson L, Abrams S, Bastiaens H. Cardiovascular disease knowledge, risk perception and socioeconomic disparities among adults in vulnerable communities of Belgium and England. BMC Public Health. 2022;22(1):197. Available from:https://doi.org/10.1186/s12889-022-12608-z
- Bridger Staatz C, Kelly Y, Lacey RE, Blodgett JM, George A, Arnot M, et al. Socioeconomic position and body composition in childhood in high- and middle-income countries: a systematic review and narrative synthesis. Int J Obes. 2021;45(11):2316-2334. Available from:https://doi.org/10.1038/s41366-021-00899-y
- Snow MS. The invasion of Ukraine and the global food crisis of 2022: responding to food supply shocks. In: The Great Power Competition Volume 5. Springer Nature Switzerland; 2023. p. 351-387.
- Buszkiewicz JH, Hill HD, Otten JJ. Association of state minimum wage rates and health in working-age adults using the National Health Interview Survey. Am J Epidemiol. 2021;190(1):21-30. Available from: https://doi.org/10.1093/aje/kwaa018
- Theis DR, White M. Is obesity policy in England fit for purpose? Milbank Q. 2021;99(1):126-170. Available from: https://doi.org/10.1111/1468-0009.12498
- Opotow S. Subverting an ethical code: APA and the post-9/11 war on terror. Qual Psychol. 2022;9(3):344. Available from:https://psycnet.apa.org/record/2022-46148-001
- Azen R, Walker CM. Categorical data analysis for the behavioral and social sciences. Routledge; 2021. Available from:https://www.routledge.com/Categorical-Data-Analysis-for-the-Behavioral-and-Social-Sciences/Azen-Walker/p/book/9780367352769
- Privitera GJ. Research methods for the behavioral sciences. Sage Publications; 2024.
- Gilman J, Walls L, Bandiera L, Menolascina F. Statistical design of experiments for synthetic biology. ACS Synth Biol. 2021;10(1):1-18. Available from:https://doi.org/10.1021/acssynbio.0c00385
- Hallquist MN, Wright AG, Molenaar PCM. Problems with centrality measures in psychopathology symptom networks. Multivariate Behav Res. 2021;56(2):199-223. Available from: https://doi.org/10.1080/00273171.2019.1640103
- Ayenew LG, Hoelscher MA, Emshoff JG, Kidder DP, Ellis BA. Evaluation of the public health achievements made by projects supported by a federal contract mechanism at the Centers for Disease Control and Prevention (CDC), USA. Eval Program Plann. 2021;88:101949. Available from: https://doi.org/10.1016/j.evalprogplan.2021.101949
- Liu Y, Trude ACB, Song S, Jiang N, Wang S, Gittelsohn J, et al. Childhood obesity inequality in northeast China. BMC Public Health. 2023;23(1):318. Available from:https://doi.org/10.1186/s12889-023-15194-w
- Anderson LN, Fatima T, Shah B, Smith BT, Fuller AE, Borkhoff CM, et al. Income and neighbourhood deprivation in relation to obesity in urban dwelling children 0–12 years of age: a cross-sectional study from 2013 to 2019. J Epidemiol Community Health. 2022;76(3):274-280. Available from: https://doi.org/10.1136/jech-2021-216455
- Gómez G, Kovalskys I, Leme ACB, Quesada D, Rigotti A, Cortes Sanabria LY, et al. Socioeconomic status impact on diet quality and body mass index in eight Latin American countries: ELANS study results. Nutrients. 2021;13(7):2404. Available from: https://doi.org/10.3390/nu13072404
- Green H, Fernandez R, MacPhail C. Social determinants of health and health outcomes among adults during the COVID-19 pandemic: a systematic review. Public Health Nurs. 2021;38(6):942-952. Available from: https://doi.org/10.1111/phn.12959
- Bubach S, Horta BL, Gonçalves H, Assunção MCF. Early age at menarche and metabolic cardiovascular risk factors: mediation by body composition in adulthood. Sci Rep. 2021;11(1):148. Available from: https://doi.org/10.1038/s41598-020-80496-7
- Ayuningtyas D, Hapsari D, Rachmalina R, Amir V, Rachmawati R, Kusuma D. Geographic and socioeconomic disparity in child undernutrition across 514 districts in Indonesia. Nutrients. 2022;14(4):843. Available from: https://doi.org/10.3390/nu14040843
- Gao M, Wells JC, Johnson W, Li L. Socio-economic disparities in child-to-adolescent growth trajectories in China: findings from the China Health and Nutrition Survey 1991–2015. Lancet Reg Health West Pac. 2022;21. Available from:https://doi.org/10.1016/j.lanwpc.2022.100399
- Mekonnen T, Papadopoulou E, Arah OA, Brantsæter AL, Lien N, Gebremariam MK. Socioeconomic inequalities in children’s BMI trajectories in Norway. Sci Rep. 2021;11(1):4979. Available from: https://doi.org/10.1038/s41598-021-84615-w
- Victora CG, Christian P, Vidaletti LP, Gatica-Domínguez G, Menon P, Black RE. Maternal and child undernutrition in LMICs. Lancet. 2021;397(10282):1388-1399.
- Victora CG, Christian P, Vidaletti LP, Gatica-Domínguez G, Menon P, Black RE. Maternal and child undernutrition in LMICs. Lancet. 2021;397(10282):1388-1399.
- Udalova V, Bhatia V, Polyakova M. Association of family income with morbidity and mortality among US lower-income children and adolescents. JAMA. 2022;328(24):2422-2430. Available from: https://doi.org/10.1001/jama.2022.22778
- Shebanina E, Burkovska A, Lunkina T. Global aspects of food security in the world: economic dimensions. 2023. Available from: https://doi.org/10.31521/modecon.v38%282023%29-27
- Power M. Revising perspectives on neoliberalism, hunger and food insecurity. In: Hunger, Whiteness and Religion in Neoliberal Britain. Policy Press; 2022. p. 18-36.
- Kumar P, Srivastava S, Chauhan S, Patel R, Marbaniang SP, Dhillon P. Socio-economic inequality in thinness and stunting among adolescents in Uttar Pradesh and Bihar, India. PLoS One. 2021;16(2):e0247526. Available from: https://doi.org/10.1371/journal.pone.0247526
- Kåks P, Målqvist M, Forsberg H, Fjellborg AA. Neighborhood income inequality, maternal deprivation and neonatal health in Sweden. SSM Popul Health. 2025;29:101745. Available from: https://www.sciencedirect.com/science/article/pii/S2352827324001460
- Malovic P, Bjelica D. Impact of socioeconomic status on obesity of adolescents. Iran J Public Health. 2021;50(11):2337. Available from: https://doi.org/10.18502/ijph.v50i11.7591
- Galvan MC, Pyrczak F. Writing empirical research reports: a basic guide for students of the social and behavioral sciences. Routledge; 2023.
- Wang K, Wu C, Yao Y, Zhang S, Xie Y, Shi K, Yuan Z. Socio-economic factors and obesity risk among Chinese adults. Glob Health Res Policy. 2022;7(1):41. Available from: U8--https://doi.org/10.1186/s41256-022-00274-y