Research Article
Behavioral factors of Abdominal Obesity and effects of lifestyle changes with Fiber Adequacy

Roberto Carlos Burini1,2*, Hugo Tadashi Kano1,3, Mariana Santoro Nakagaki1,4, Patricia Baston Frenhani5 and Katia Cristina Portero-McLellan6,7
1Nutritional and Exercise Metabolism Center, UNESP School of Medicine, São Paulo State University, Brazil
2Full Professor, Department of Public Health, UNESP School of Medicine, Brazil
3Graduate Student of Pathology, UNESP School of Medicine, São Paulo State University, Brazil
4Graduate Student of Physical Education, Londrina State University (UEL), Physical Education and Sport Center, Parana, Brazil
5Associate Professor, Nutrition School, PUC University-Campinas, Sao Paulo, Brazil
6Human Sciences, Food, Nutrition and Dietetics. Stephen F. Austin State University, Nacogdoches, Texas, USA
7Texas Institute for Kidney and Endocrine Disorders, Lufkin, Texas, USA
*Address for Correspondence: Dr. Roberto Carlos Burini, Nutritional and Exercise Metabolism Center, UNESP School of Medicine, São Paulo State University, Brazil, Email: [email protected]
Dates: Submitted: 15 June 2017; Approved: 24 July 2017; Published: 25 July 2017
How to cite this article: Burini RC, Kano HT, Nakagaki MS, Frenhani PB, McLellan KCP. Behavioral factors of Abdominal Obesity and effects of lifestyle changes with Fiber Adequacy. New Insights Obes Gene Beyond. 2017; 1: 014-022. DOI: 10.29328/journal.niogb.1001004
Copyright License: © 2017 Burini RC, et al. This is an open access article distributed under the Creative Commons Attribution License, which permits unrestricted use, distribution, and reproduction in any medium, provided the original work is properly cited.
Keywords: Abdominal obesity, Nutrition, Physical activity, Lifestyle modification program, Fiber adequacy
Contributions: RCB mentor of the project, principal investigator, wrote the preliminary draft; HTK contributed with general-data survey and statistical analysis; MSN contributed with the survey and analysis of physical activity data; PBF overviewed the dietary data and reviewed the manuscript; KCPM contributed with the writings, literature review and reviewed the manuscript; All authors read and approved the final version of the manuscript.

ABSTRACT
The etiology of abdominal obesity is multifactorial and has environmental factors as its most expressive risk factors. This study cross-sectional analyzed the association of abdominal fatness with physical inactivity and food inadequacy of 1,557 subjects, both genders, over 35yrs. old, enrolled in an ongoing epidemiological study. Waist circumference (WC) was the primary variable and demographic, social-economic, anthropometric and dietary intake data, were the co-variables. NCEP-ATP III, WHO, IPAQ-long (version 8) and Healthy Eating Index were used for functional definition of variables. Furthermore, longitudinal data from 50 subjects in an exercise protocol for 10 week receiving either regular diet (G1, n=22) or 30g fiber adequacy (G2; =28), were analyzed. The performed statistical analyses used software SAS for Windows, version 9.1 with p=0.05. In a predominantly female sample (74%), 76% aging 35-60yrs, 64% completed elementary school, 73% were living in a low income household, 77.5% overweight. The 62.5% presenting altered WC values were predominantly older, presented higher body fatness, and were consuming low variety-poor quality diet rich in fat (mainly saturated) and lower in fruit. WC correlated negatively with fruit intake and aerobic capacity (VO2max) but only carbohydrate (positive) and fruit intake (negative) were considered independent risk factors for abdominal obesity. In the longitudinal study, both G1 and G2 groups were similar at baseline and G1 maintained the anthropometry values throughout the experiment. Conversely, G2 decreased total body (4%) and WC (7%) fatness, reducing severe obesity by 16%, minimally affecting overweight and eutrophic rates. G2 presented 211% increase in fiber intake and 150% increase in plasma beta-carotene (colorful-fiber marker). Thus, in conclusion, recommended dietary fiber intake (increased fruit and low CHO intake) and physical activity would be the recommended changes against abdominal obesity and, by associating both physical exercises and dietary fiber there was indeed a decrease in abdominal fatness and obesity, predominantly at its higher grade.
INTRODUCTION
Obesity is considered one of the greatest public health problems worldwide [1]. Abdominal obesity is the main component of Metabolic Syndrome [2] and, an independent risk factor for cardiovascular diseases, type-2 diabetes mellitus, high blood pressure, dyslipidemias [3,4], hyperuricemia [5], inflammation [6], fibrinolysis, acceleration of atherosclerosis and some types of cancer [7].
Although abdominal adiposity is multifactorial, environmental factors are the most expressive risk factors. Central obesity are caused by poor eating habits [8] and low levels of physical activity [9], with the resultant excess energy causing weight gain [10]. A long-term energy imbalance between intake and expenditure would be the primary cause. Hence, limiting positive- energy balance would be a key objective when weight loss is the goal and, lifestyle modification focusing on improving dietary quality and physical activity is the preferred first-line treatment for the management of body fatness [11]. However, attempts to modify lifestyle to improve dietary quality and physical fitness are often unsuccessful due to long lasting standing necessary to accomplish the goal and, consequently low compliance. Therefore, simpler approaches to diet and physical activity have been under investigation [12].
To prescribe optimal amount of energy intake to achieve a healthy body weight, some researchers have looked even further and investigated the possibility that consuming certain dietary factors may aid in weight regulation. Increased dietary fiber intake is a strategy to dilute the consumed energy [13].
The present paper used retrospectively data from our ongoing epidemiological study [2,11] aiming to detect the main behavioral factors associated with abdominal obesity in our community-based patients and thereafter, check their responses to a lifestyle modification protocol complemented with recommended dietary fiber.
METHODS
Adults (over 35yrs old), spontaneously enrolled in the ongoing epidemiological study “Move for Health” (Mexa-se pro-saude), during the period of 2004-2009. These subjects had their data analyzed retrospectively (cross-sectional design; n=1,557; baseline) and prospectively (longitudinal design; n=50; baseline and after a 10-week intervention program). All individuals signed up the informed-consent form and the project was approved by the Research Ethics Committee (document nº 3271/2009-CEP) of the Botucatu School of Medicine (FMB-UNESP). The cross-sectional analysis had waist circumference as primary variable and demographic, socioeconomic, physical activity, anthropometric and dietary food intake data as co-variables.
Physical activity level (LPA), socio-demographic characteristics and health status were obtained by applying the International Physical Activity Questionnaire (IPAQ version 8-long form) [14]. Cardiorespiratory fitness was determined as maximal oxygen uptake (VO2max), using a treadmill (QMCTM90model) according to the Blake protocol [15]. Weight, height, waist circumference (WC) were measured with standardized protocols [16]. Body Mass Index (BMI) and waist circumference were evaluated according to the World Health Organization [17]. Body fat percentage was assessed by a bioelectrical impedance device (Biodynamics ®, model 450, USA). The NCEP-ATP III (2005) definitions were used for cut-offs of WC (>88cm for women) and >102cm for men) along with WHO (2003) for anthropometry.
Dietary intake data was assessed using a single 24-hour dietary recall a baseline (M0) and after 10 weeks (M1). Total energy intake was computed using Brazilian food tables [18-20]. The Healthy Eating Index (HEI) modified for the Brazilian population was used to assess the quality and of the participants diet [21]. Eight food groups and 12 components to measure the variety and quality of food intake were evaluated. Blood samples were collected by vacuum venous puncture, after a 10 to 12 hour fasting period, and centrifuged to obtain serum samples which were stored at -80ºC until the end of the study. β-carotene were assayed by high-performance liquid chromatography (HPLC, System LC10A, Shimadzu, Japan).
For the longitudinal study, voluntary participants were assigned in two dietary groups receiving either a regularly counseled diet (G1, n=22) or a supervised intervention (G2, n=28) with grains, fruits and vegetables making a total of 30g fiber/day. Both groups were maintained, during 10 weeks in an aerobic-intensity combined-exercises supervised-protocol [22].
Statistical analysis included mean comparisons of continuous (Student t test) and cathegorized (chi-square test) variables. Pearson’s correlation between waist circumference and the co- variables, and logistic regression model (odds ratio) to determine association of co-variables and WC. In the longitudinal study, the comparison between moments was done by the Student paired t test. All the statistical analyses were done by the software SAS for Windows, version 9.1 and p<0.05 was adopted for minimal significance level (Figure 1).
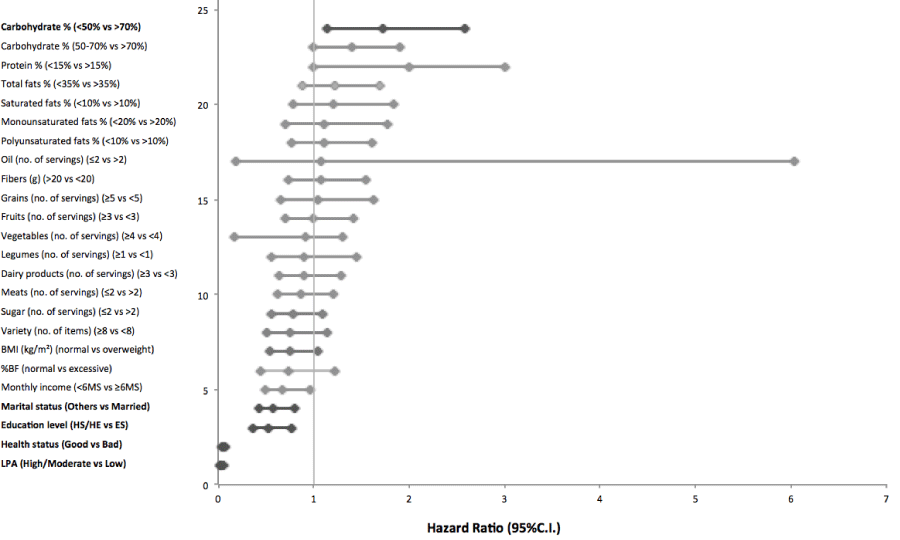
Figure 1: Independent predictors of the presence of altered Waist Circumference. Logistic regression model including WC, used as a dichotomic variable (altered and normal).Hazard ratios are calculated for 1 SD of the continuous variables.
RESULTS
The sample consisted of overweight (77.5%), female (74%) individuals with less than 60 years of age (76%) with high WC values (62.5%). The majority of individuals reported values of household income under six minimum salaries (73%) and elementary education (64%).
Table 1 shows that individuals with altered WC were older, heavier and had greater percentage of body fat. Additionally, they had a monotonous diet, with greater amounts of total and saturated fats, and fewer daily servings of fruit. There was a positive correlation between WC and anthropometric measurements (weight, BMI, percentage of body fat), food intake (total energy) and a negative correlation with VO2max (Table 2).
| Table 1: Characteristics of individuals with normal and altered waist circumference (WC). | |||
| Waist Circumference (cm) | |||
| Normal (n=530) | Altered (n=1027) | ||
| Parameters | (♀<88cm /♂<102cm) | (♀>88cm /♂>102cm) | p |
| Age (years) | 51.7+11.1 | 53.5+11.2 | 0.001 |
| Weight (kg) | 65.4+11.1 | 81.8+15.9 | <0.0001 |
| Height (m) | 1.61+0.09 | 1.60+0.09 | 0.002 |
| BMI (kg/m2) | 24.9+2.9 | 31.8+4.9 | <0.0001 |
| Body fat (%) | 26.5+5.2 | 37.2+7.9 | <0.0001 |
| LPA (min/week) | 739+341 | 397+298 | 0.01 |
| TEI (kcal) | 1,541+651 | 1,549+703 | 0.87 |
| Carbohydrates (%) | 52.9+9.7 | 51.5+10.5 | 0.06 |
| Protein (%) | 18.2+5.8 | 18.3+5.6 | 0.75 |
| Total fats (%) | 28.8+8.2 | 30.5+8.6 | 0.006 |
| Saturated fats (%) | 8.2+3.6 | 8.7+4.2 | 0.047 |
| Monounsaturated fats (%) | 8.8+3.5 | 9.3+3.5 | 0.08 |
| Polyunsaturated fats (%) | 7.5+3.9 | 7.6+3.8 | 0.53 |
| Fibers (g) | 14.4+8.3 | 14.1+8.6 | 0.63 |
| HEI (score) | 79.8+14.6 | 79.1+14.8 | 0.53 |
| Oil (servings) | 2.1+1.8 | 2.2+2.0 | 0.5 |
| Grains (servings) | 3.4+1.8 | 3.4+1.9 | 0.8 |
| Fruits and vegetables (g) | 353+280 | 296+244 | 0.07 |
| Fruits (servings) | 2.5+2.8 | 2.1+2.7 | 0.03 |
| Vegetables (servings) | 2.0+2.1 | 2.0+2.2 | 0.99 |
| Legumes (servings) | 1.5+1.7 | 1.3+1.7 | 0.15 |
| Dairy products (servings) | 1.4+1.3 | 1.3+1.3 | 0.67 |
| Meats (servings) | 1.7+1.3 | 1.7+1.4 | 0.75 |
| Sugar (servings) | 1.5+2.0 | 1.5+2.0 | 0.88 |
| Variety (items) | 12.3+4.4 | 11.7+4.0 | 0.049 |
| Data expressed as Mean±Standard Deviation. p<0.05. | |||
| BMI: Body Mass Index; TEI: Total Energy Intake; HEI: Healthy Eating Index. LPA: Level of Physical Activity. | |||
| Table 2: Pearson’s correlation coefficient between abdominal adiposity and anthropometric, dietary and physical activity variables. | ||
| Altered Waist Circumference (♀>88cm /♂>102cm) | ||
| Parameters | r | p |
| Weight (kg) | 0.84 | <0.0001 |
| BMI (kg/m²) | 0.83 | <0.0001 |
| Body fat (%) | 0.55 | <0.0001 |
| VO2max (mL·kg-1·min-1) | -0.33 | <0.0001 |
| BMI: Body Mass Index; VO2max: maximum oxygen consumption. p<0.05. | ||
Individuals who consumed at least three servings of fruit per day and did not exceed the upper limit of saturated fat intake were 35% and 28%, respectively, less likely to have abdominal adiposity. After adjustments for age, gender and energy intake, CHO and fruit intake remained as independent factors for altered WC (Table 3).
| Table 3: Odds ratio for altered waist circumference according to dietary intake. | ||
| Parameters | OR (CI 95%) Model 1 |
OR (CI 95%) Model 2 |
| Carbohydrate % (<50% vs >70%) | 1.64 (1.11-1.43)* | 1.72 (1.14-2.58)* |
| Carbohydrate % (50-70% vs >70%) | 1.43 (0.96-2.12) | 1.40 (0.94-2.12) |
| Protein % (<15% vs >15%) | 0.94 (0.69-1.87) | 0.87 (0.63-1.21) |
| Total fats % (<35% vs >35%) | 0.80 (0.53-1.13) | 0.90 (0.64-1.29) |
| Saturated fats % (<10% vs >10%) | 0.71 (0.52-0.99)* | 0.79 (0.56-1.10) |
| Monounsaturated fats % (<20% vs >20%) | 0.69 (0.13-3.57) | 1.08 (0.19-6.03) |
| Polyunsaturated fats % (<10% vs >10%) | 1.02 (0.72-1.45) | 1.07 (0.73-1.54) |
| Oil (no. of servings) (≤2 vs >2) | 1.24 (0.92-1.67) | 1.23 (0.89-1.70) |
| Fibers (g) (>20 vs <20) | 0.75 (053-1.06) | 0.76 (0.51-1.14) |
| Grains (no. of servings) (≥5 vs <5) | 1.09 (0.75-1.61) | 1.11 (0.70-1.78) |
| Fruits (no. of servings) (≥3 vs <3) | 0.65 (0.48-0.82)* | 0.68 (0.49-0.96)* |
| Vegetables (no. of servings) (≥4 vs <4) | 1.05 (0.69-1.58) | 1.04 (0.66-1.63) |
| Legumes (no. of servings) (≥1 vs <1) | 0.75 (0.56-1.01) | 0.76 (0.55-1.05) |
| Dairy products (no. of servings) (≥3 vs <3) | 0.72 (0.46-1.13) | 0.74 (0.44-1.23) |
| Meats (no. of servings) (≤2 vs >2) | 1.00 (0.72-1.40) | 1.11 (0.77-1.61) |
| Sugar (no. of servings) (≤2 vs >2) | 1.00 (0.72-1.40) | 0.91 (0.17-1.30) |
| Variety (no. of items) (≥8 vs <8) | 1.10 (0.70-1.70) | 0.90 (0.56-1.45) |
| OR: Odds ratio; CI: confidence interval. Model 1: no adjustment; Model 2: adjusted for gender, age and total energy intake. *p<0.05. | ||
Body composition, demographic and socioeconomic data were also associated with abdominal adiposity. In both models, having a normal BMI and percentage of body fat reduced the chances of having altered WC by 96% and 92%, respectively (Model 1), and the chances increased by 1% and 3%, respectively, after adjustment for gender and age (Model 2). Similarly, individuals in good health conditions and physically active were 41% and 40%, respectively, less likely to have altered WC (Model 1) and, after adjustment (Model 2), the chances increased to 42% and 47%, respectively. Before adjustment (Model 1), household income below 6 minimum wages per month and not being married or living with a partner (other marital status) increased the likelihood for abdominal adiposity by 1.6 and 2.2 times, respectively. However, after adjusting for gender and age (Model 2), marital status lost influence and a household income below 6 minimum wages per month increased the likelihood of abdominal adiposity by 1.4 times (Table 4).
| Table 4: Odds ratio for altered waist circumference secondary to body composition, socioeconomic data and level of physical activity. | ||
| Parameters | OR (CI 95%) Model 1 |
OR (CI 95%) Model 2 |
| BMI (kg/m²) (normal vs overweight) | 0.04 (0.03-0.06)* | 0.03 (0.02-0.05)* |
| %BF (normal vs excessive) | 0.08 (0.01-0.06)* | 0.05 (0.04-0.08)* |
| Monthly income (<6MW vs ≥6MW) | 1.64 (1.21–2.22)* | 1.40 (1.00–1.91) |
| Marital status (Others vs Married) | 2.23 (1.60-3.13)* | 1.20 (0.78-1.84) |
| Education level (HS/HE vs ES) | 0.91 (0.65-1.26) | 1.00 (0.70-1.42) |
| Health status (Good vs Bad) | 0.59 (0.44-0.80)* | 0.58 (0.43-0.80)* |
| LPA (High/Moderate vs Low) | 0.60 (0.42-0.85)* | 0.53 (0.36-0.77)* |
| Model 1: no adjustment. Model 2: adjusted for gender and age. OR: Odds ratio; CI: Confidence Interval; BMI: Body Mass Index; %BF: percentage of Body Fat; Marital status: others= single/widowed/divorced; married= married or living with partner; MW: Minimum Wages; Education level: HS=High School, HE=Higher Education, ES=Elementary School; LPA=level of Physical Activity; *p<0.05. | ||
Thus, individuals with altered WC were older, obese and had a greater percentage of body fat. Additionally, their diet was high in fat and low in fruits. Low intake of whole grains was risk factor for altered WC whereas, adequate consumption of fruit and physical activity showed to be protective against abdominal adiposity (Table 1-4).
The longitudinal study showed that the control group maintained the anthropometric values throughout the experiment while the intervention group had a reduction of weight, body fat, and WC, after 10 weeks of intervention. In addition, overweight/obese adults of the intervention group (G2) increased their HEI by improving dietary intake by 211%, mainly from colorful foods as suggested by the 150% increase in plasma Beta-carotene. However, the impact on BMI was less on overweight and more detectable by the migration of obese class III to class II (2%) and from this to obese I (14%) grade with less impact on overweight and eutrophy (Table 5).| Table 5: Body composition, aerobic fitness (VO2max.), food intake and beta-carotenemia of control (G1) and high dietary fiber (G2) groups at baseline (M0) and after 10 weeks of intervention (M1). | |||
| Parameters | Group | M0 | M1 |
| Body weight (kg) | G1 | 85.6±19.1 | 86.0±19.4 |
| G2 | 89.1±19.4 | 85.4±18.7 a, b | |
| BMI (kg/m2) | G1 | 32.1±5.3 | 32.2±5.4 |
| G2 | 33.5±5.3 | 32.1±5.1 a, b | |
| Body Fat (%) | G1 | 36.7±9.5 | 36.5±9.3 |
| G2 | 38.6±8.8 | 37.2±8.8 a, b | |
| WC (cm) | G1 | 103.2±12.7 | 103.7±14.0 |
| G2 | 106.7±14.4 | 101.4±14.2 a, b | |
| VO2max (mL·kg-1·min-1) | G1 | 30.8±8.4 | 28.6±10.8 |
| G2 | 26.1±6.4 | 25.1±5.7 | |
| TEI (kcal/kg Body Weight/day) | G1 | 16.1 (8.6-45.7) | 14.1 (6.6-45.7) |
| G2 | 17.6 (7.6-38.0) | 17.12 (8.7-19.5) | |
| HEI (points) | G1 | 83.3±8.3 | 84.2±8.3 |
| G2 | 76.9±15.5 | 97.2±11.0 a, b | |
| Legumes (servings/day) | G1 | 1.82 (0.0-6.5) | 1.11 (0.0-4.0) |
| G2 | 1.70 (0.0-8.5) | 1.77 (0.0-5.5) | |
| Fruits+vegetables (servings/day) | G1 | 240.2 (0.0-842.0) | 260.0 (20.0-918.0) |
| G2 | 231.0 (0.0-937.0) | 539.0 (127.0-909.0) a, b | |
| Fruits (servings/day) | G1 | 1.7 (0.0-10.5) | 2.0 (0.0-10.0) |
| G2 | 1.5 (0.0-10.5) | 4 (0.5-8.5) a, b | |
| Vegetables (servings/day) | G1 | 1.0 (0.0-5.0) | 1.0 (0.0-5.0) |
| G2 | 0.5 (0.0-4.0) | 1.7 (0.5-5.5) a, b | |
| Dietary Fibers (g/day) | G1 | 16.1±7.8 | 17.1±9.4 |
| G2 | 15.2±7.0 | 32.1±8.9 a, b | |
| Oils (servings/day) | G1 | 2 (0.5-9.5) | 1.5 (0.5-4.5) |
| G2 | 1.9 (0.0-9.5) | 0.75 (0.0-2.5) a, b | |
| β-carotene (mmol/L) | G1 | 0.5±0.2 | 0.5±0.3 |
| G2 | 0.4±0.01 | 0.6±0.3 a, b | |
| Data expressed as mean±standard deviation or median (min. - max.). G1, n=22. G2, n=28. | |||
| BMI; Body Mass Index; WC: waist circumference; VO2max: maximum oxygen consumption. | |||
| TEI: Total Energy Intake; HEI: Healthy Eating Index | |||
| a statistical difference after intevention (p<0.05).b statistical difference between groups (p<0.05). | |||
DISCUSSION
Similarly to others studies we found a significant association between body weight and abdominal adiposity [23,24]. Waist circumference is the anthropometric measurement that best correlates with the amount of visceral fat [25].
In the present study, 77.5% of the participants were overweight or obese, and 62.5% had altered WC. Altered WC was related to inadequate diet, (low intake of fruit and whole grains), altered anthropometry and, lower socioeconomic and physical activity levels. A similar study done in the southern region of Brazil, found prevalence of abdominal obesity of 37.2% for males and 61.9% for females [24]. Since the participants joined the program spontaneously, the prevalence of females may be explained by the fact that women are more concerned with their health and quality of life [26,27].
Altered WC was more prevalent in older individuals, as confirmed by many other studies [7,24,28,29]. Additionally being married or living with a partner was a risk factor for abdominal obesity, however, under the influences of gender and age. A study performed in the southern Brazil found that widows and widowers were at higher risk of altered WC [7]. However, other studies claim the opposite, by showing that a partner is a risk factor for abdominal adiposity [7, 24]. The present study grouped individuals in two categories, married or living with a partner and other, which included being single, separated, divorced or widowed, which may explain the disagreement.
The present study found that low income increases risk of abdominal obesity, which is corroborated by other study done in Brazil [24]. No association was found between level of education and abdominal adiposity, in agreement with some [28] but in disagreement with other studies [7,24,28,29] reporting that high education level protects against abdominal adiposity. The present study found an inverse relationship between VO2max and abdominal adiposity, similarly to findings by Fogelholm et al. [30]. Physical activity directly impacts cardiorespiratory capacity, which in turn benefits health and may protect against altered WC (moderate to high level of physical activity). This is confirmed by a study conducted in the metropolitan area of São Paulo city that found a strong inverse association between level of physical activity and abdominal obesity [31].
Few studies have assessed the relationship between diet and accumulation of abdominal fatness. The present study found that total energy intake correlates weakly with WC. This may be due to two factors: reverse causality, in which individuals may change their food habits because of abdominal adiposity, and underreporting, since food inquiries are generally susceptible to under- or over reporting of nutrient and energy intakes, and underreporting is somewhat more common [32]. According to several authors [32-34], obesity is a major indicator of energy intake under reporting, specially female and with more than 60 years. On the other hand, consumption of 3 or more servings of fruit per day was protective against altered WC, even after adjustments. Levy-Costa et al. studying the household food availability in Brazil (1974 to 2003) found a low consumption of produce, which might explain the high rates of abdominal adiposity in Brazil [35].
Thus, in our cross-sectional analysis we concluded that adequate fruit intake and good levels of physical activity would protect our sample against abdominal adiposity while low intake of whole grains would promotes it. Hence, by planning and implementing effective lifestyle modification strategies and actions regarding regularly physical exercises and recommended dietary fiber intake would be important for preventing or reducing abdominal obesity.
In fact, our longitudinal data showed that intervention with physical activity and recommended dietary fiber intake improved not only of HEI but also body fatness. The dietary components most strongly related to the body composition improvements were fibers (fruits and legumes).
Although participants’ HEI continued classified as “poor quality”, a significant greater increase occurred in participants in the intervention group (20.3 points), compared to the ones on the compared group (0.9 points). This likely reflects the improved dietary quality and better food choices adopted during the 10 week intervention.
The adoption of general dietary guidelines, or ad-libitum intake, has been studied and shown promising results [36-38]. The free-choice approach to diet and physical activity has been described as a potential method to improve adherence to lifestyle changes [39]. Our dietary counseling approach allowed flexibility for individuals to modify their dietary intake, supported by offering practical strategies, such as suggestions, for ingredients substitution in recipes and different cooking methods.
Hence, the lifestyle intervention used in this study is an example of community education strategy, aimed to provide to all participants information and skills to assist them in achieving recommendations for diet and physical activity [40]. Additionally, it was offered practical strategies to assist in food choices. Because participants were allowed to choose which dietary behavioral changes they would incorporate into their lifestyles, it was anticipated that these behaviors would be easier to sustain long term. This builds upon well-established principles of health promotion, i.e. by making healthy choices will continue to make those choices [12].
Thus, in conclusion, recommended dietary fiber intake (increased fruit and low CHO intake) and physical activity would be the recommended lifestyle changes against abdominal obesity and, by associating both physical exercises and dietary fiber there was indeed a higher effectiveness, predominantly at the higher grades of overweight. Moreover, this program may be more applicable to the community setting than individualized diet and exercise programs, which require intensive input to facilitate behavioral change. Additionally the group-based approach may be less expensive than individualized strategies.
ACKNOWLEDGEMENT
The authors are grateful to CAPES (Coordenação de Aperfeiçoamento de Pessoal de Nível Superior) and CNPq (Conselho Nacional de Desenvolvimento Científico e Tecnológico).
REFERENCES
- Hossain P, Kawar B, El Nahas M. Obesity and diabetes in the developing world--a growing challenge. N Engl J Med. 2007; 356: 213-215. Ref.: https://goo.gl/EUutCH
- Burini RC, Kano HT, Burini FHP, McLellan KCP. Metabolic Syndrome-From the Mismatched Evolutionary Genome with the Current Obesogenic Environment to the Lifestyle Modification as a Primary Care of Free-Living Adults in a Brazilian Community. In: Jody Morton editor. Metabolic Syndrome: Clinical Aspects, Management Options a53610-723-4nd Health Effects. Nova Science Publ. (NY) ebook.Chap.5, 2017.
- De Oliveira EP, Manda RM, Torezan GA, Corrente JE, Burini RC. Dietary, anthropometric, and biochemical determinants of plasma high-density lipoprotein-cholesterol in free-living adults. Cholesterol. 2011; 2011: 851750. Ref.: https://goo.gl/ZCq6C8
- De Oliveira EP, Camargo KF, Castanho GK, Nicola M, Portero-McLellan KC, et al. Dietary variety is a protective factor for elevated systolic blood pressure. Arq Bras Cardiol. 2012; 98: 338-343. Ref.: https://goo.gl/qP8Jrk
- De Oliveira EP, Burini RC. High plasma uric acid concentration: causes and consequences. Diabetol Metab Syndr. 2012; 4: 12. Ref.: https://goo.gl/ibJp5Z
- Orsatti FL, Nahas EA, Orsatti CL, de Oliveira EP, Nahas-Neto J, et al. Muscle mass gain after resistance training is inversely correlated with trunk adiposity gain in postmenopausal women. J Strength Cond Res. 2012; 26: 2130-2139. Ref.: https://goo.gl/4iKskg
- Olinto MT, Costa JS, Kac G, Pattussi MP. Abdominal obesity epidemiology amongst adult women resident in Southern Brazil. Arch Latinoam Nutr. 2007; 57: 349-356. Ref.: https://goo.gl/oFkYm9
- WHO, FAO. Diet, nutrition and the prevention of chronic diseases. A report of the WHO Study Group on Diet, Nutrition and Prevention of Noncommunicable Diseases. Nutr Rev. 1991; 49: 291-301. Ref.: https://goo.gl/X6TVEA
- Monteiro RCA, Riether PTA, Burini RC. Effect of a mixed program of nutritional intervention and exercise on body composition and dietary habits in obese postmenopausal women. Rev Nutr. 2004; 17: 479-489.
- Walley AJ, Blakemore AI, Froguel P. Genetics of obesity and the prediction of risk for health. Hum Mol Genet. 2006; 15: 124-130. Ref.: https://goo.gl/yFPcCB
- Burini RC, de Oliveira EP, Michelin E, McLellan KCP. Epidemic obesity: An Evolutionary Perspective on the Modern Obesity Crisis to a Rationale for a Treatment. In Obesity Epidemic. 2014; Ref.: https://goo.gl/dx86lQ
- Pettman TL, Buckley JD, Misan GMH, Coates AM, Howe PRC. Health benefits of a 4-mo groups-based diet and lifestyle modification program for individuals with metabolic syndrome. Obes Res Clin Pract. 2009; 3: 221-235. Ref.: https://goo.gl/itEcDy
- Slavin JL. Dietary fiber and body weight. Nutrition. 2005; 21: 411-418. Ref.: https://goo.gl/bgR2tj
- Craig CL, Marshall AL, Sjöström M, Bauman AE, Booth ML, et al. International physical activity questionnaire: 12-country reliability and validity. Med Sci Sports Exerc. 2003; 35: 1381-1395. Ref.: https://goo.gl/8qEXqt
- Balke B, Ware RW. An experimental study of Air Force personel. US Armed Forces Med J. 1959; 10: 675-688. Ref.: https://goo.gl/DuXkpb
- Janssen I, Heymsfield SB, Baumgartner RN, Ross R. Estimation of skeletal muscle mass by bioelectrical impedance analysis. J Appl Physiol. 2000; 89: 465-471. Ref.: https://goo.gl/ujPfzD
- World Health Organization. Obesity: Preventing and managing the global epidemic. Report of a WHO Consultation. World Health Organ Tech Rep Ser. 1998; Ref.: https://goo.gl/nUZrrD
- NEPA/UNICAMP. Tabela brasileira de composição de alimentos. Taco. Versão 1. Campinas; 2004.
- Instituto Brasileiro de Geografia e Estatística. Tabela de Composição de Alimentos. Rio de Janeiro. 1999.
- Philippi ST. Tabela de Composição de Alimentos: Suporte para decisão nutricional. São Paulo. 2002
- Mota JF, Rinaldi AEM, Pereira AF, Maestá N, Scarpin MM, et al. Adaptação do Índice de Alimentação Saudável ao Guia Alimentar da População Brasileira. Rev Nutr. 2008; 21: 545-552. Ref.: https://goo.gl/B7H51Q
- Burini RC, Kano HT, Nakagaki MS, das Neves Mendes Nunes C, Burini FHP. The lifestyle modification effectiveness in reducing Hypertension in a Brazilian Community: From the epigenetic basis of Ancestral Survival to the Contemporary Lifestyle and Public Health Initiatives. Heighpubs J Clin Hypertens. 2017; 1: 10-31. Ref.: https://goo.gl/Exjbq8
- Castanheira M, Olinto MT, Gigante DP. Socio-demographic and lifestyle factors associated with abdominal fat distribution in adults: a population-based survey in Southern Brazil. Cad Saude Publica. 2003; 19: 55-65. Ref.: https://goo.gl/RgjcCj
- Olinto MT, Nacul LC, Dias-da-Costa JS, Gigante DP, Menezes AM, et al. Intervention levels for abdominal obesity: prevalence and associated factors. Cad Saude Publica. 2006; 22: 1207-1215. Ref.: https://goo.gl/NGyZN4
- Kac G, Velasquez-Melendez G, Coelho MA. Factors associated with abdominal obesity among childbearing-age women. Rev Saude Publica. 2001; 35: 46-51. Ref.: https://goo.gl/KimbRR
- Bueno JM, Martinho HSD, Fernandes MFS, Costa LS, Silva RR. Nutritional assessment and prevalence of chronic diseases in the elderly participating in an assistance program. Ciênc Saúde Coletiva. 2008; 13: 1237-1246.
- Assunção TS, Ursine PGS. Study associated with adherence to non-pharmacological treatment in patients with diabetes mellitus assisted by the Family Health Program, Ventos, Belo Horizonte. Ciênc Saúde Coletiva. 2008; 13: 2189-2197.
- Oliveira EO, Velásquez-Melendez G, Kac G: Demographic and behavioral factors associated with abdominal obesity in the health center of Belo Horizonte, Minas Gerais, Brazil. Rev Nutr. 2007; 20: 361-369.
- Jaime PC, Florindo AA, Latorre MRDO, Brasil BG, dos Santos ECM, et al. Prevalence of overweight and obesity among individuals with HIV / AIDS, use of retroviral therapy in high power. Rev Bras Epidemiol. 2004; 7: 65-72.
- Fogelholm M, Malmberg J, Suni J, Santtila M, Kyrolainen H, et al. Waist circumference and BMI are independently associated with the variation of cardio-respiratory and neuromuscular fitness in young adult men. Int J Obes (Lond). 2006; 30: 962-969. Ref.: https://goo.gl/8n3uMx
- Souza LJ, Gicovate C, Chalita FEB, Reis AFF, Bastos DA, et al. Prevalence of obesity and cardiovascular risk factors in Campos, Rio de Janeiro. Arq Bras Endocrinol Metab. 2003, 47: 669-676. Ref.: https://goo.gl/UnVwYW
- Martins IS, Marinho SP. The potential of central obesity anthropometric indicators as diagnostic tools. Rev Saude Publica. 2003; 37: 760-767. Ref.: https://goo.gl/45QtsZ
- Scaglius B, Lancha Junior AH. Underreporting of energy intake in food intake assessment. Rev Nutr. 2003; 16: 471-481.
- Johansson L, Solvoll K, Bjorneboe GE, Drevon CA. Under- and overreporting of energy intake related to weight status and lifestyle in a nationwide sample. Am J Clin Nutr. 1998; 68: 266-274. Ref.: https://goo.gl/x2ZmS5
- Goris AH, Westerterp-Plantenga MS, Westerterp KR. Undereating and underrecording of habitual food intake in obese men: selective underreporting of fat intake. Am J Clin Nutr. 2000; 71: 130-134. Ref.: https://goo.gl/iiFDrw
- Levy-Costa RB, Sichieri R, Pontes Ndos S, Monteiro CA. Household food availability in Brazil: distribution and trends (1974-2003). Rev Saude Publica. 2005; 39: 530-540. Ref.: https://goo.gl/6HW7H4
- Kilkkinen A, Heistaros S, Laatikainen T, Janus E, Chapman A, et al. Prevention of type 2 diabetes in a primary health care setting: interim results from the Greater Green Triangle (GGT) Diabetes Prevention Project. Diabetes Res Clin Pract. 2007; 76: 460-462. Ref.: https://goo.gl/VnVC9U
- Sloth B, Krog-Mikkelsen I, Flint A, Tetens I, Bjorck I, et al. No difference in body weight decrease between a low- glycemic-index and a high-glycemic-index diet but reduced LDL cholesterol after 10-wk ad libitum intake of the low-glycemic-index diet. Am J Clin Nutr. 2004; 80: 337-347. Ref.: https://goo.gl/F5oTu9
- Kohl HW, Dunn AL, Marcus BH, Blair SN. A randomized trial of physical activity interventions: design and baseline data from Project Active. Med Sci Sports Exerc. 1998; 30: 275-283. Ref.: https://goo.gl/CsygKY
- Waxman A1; World Health Assembly. World Health Organization: Global strategy on diet, physical activity, and health. Food Nutr Bull. 2004; 25: 292-302. Ref.: https://goo.gl/dr5X96